Design for Aerodynamics
Design for Aerodynamics
Summary
This chapter explores the critical role of aerodynamics in vehicle design, examining how aerodynamic resistance impacts performance, fuel economy, and stability. It details the components of drag (pressure drag and skin friction), mathematical modeling of aerodynamic forces, and design optimization techniques to reduce resistance. The content compares wind tunnel and coastdown testing methods while emphasizing the cubic relationship between speed and power requirements. Practical applications range from body shape optimization to operational adjustments for existing vehicles.
Learning Objectives
Define aerodynamic resistance and its components in automotive applications
Calculate aerodynamic forces using the standard resistance equation
Analyze the relationship between vehicle speed and power requirements
Evaluate design trade-offs in body shape optimization
Compare wind tunnel and coastdown testing methodologies
Design modifications to reduce drag on existing vehicles
Assess the impact of ground clearance on aerodynamic performance
Explain the significance of Reynolds number in scale model testing
Interpret aerodynamic lift and pitching moment effects on stability
Propose integrated solutions for commercial vehicle drag reduction
What is Aerodynamic Resistance?
Definition and Importance
Aerodynamic resistance refers to the forces opposing a vehicle’s motion due to air flow. This resistance becomes increasingly important at moderate and higher speeds. For a typical passenger car cruising at speeds above approximately 80 km/h (50 mph) (Wong 2001), the power required to overcome aerodynamic resistance surpasses that needed for rolling resistance and transmission losses. The relationship between speed and required power is highly significant: aerodynamic resistance is proportional to the square of the vehicle’s speed, meaning the horsepower required to overcome it increases with the cube of speed.
Sources and Components of Aerodynamic Resistance
Aerodynamic resistance originates from two primary sources:
Air flow over the exterior of the vehicle body : This is the dominant source, accounting for more than 90% of a passenger car’s total aerodynamic resistance.
Air flow through the engine radiator system and vehicle interior : This flow serves purposes such as cooling, heating, and ventilation.
The external aerodynamic resistance is further broken down into two components:
Pressure Drag : This arises from the component of normal pressure on the vehicle body that acts against its motion. For a passenger car with a normal surface finish, pressure drag is by far the larger component, constituting over 90% of the total external aerodynamic resistance. It is also an alternative measure of momentum losses in the wake of the vehicle and energy imparted to the air by vortices.
Skin Friction : This is caused by the shear stress in the boundary layer adjacent to the vehicle’s external surface. While generally smaller than pressure drag for passenger cars, skin friction can become more significant for longer vehicles such as buses or tractor-trailer trains.
Effects of Aerodynamic Resistance on Vehicle Performance
The effects of aerodynamic resistance are far-reaching, impacting various aspects of vehicle performance (Hucho 1998):
Power Requirements : As noted, it demands a significant portion of engine power, especially at higher speeds.
Fuel Economy : A direct consequence of increased power requirements is a reduction in fuel economy. For instance, reducing the coefficient of aerodynamic resistance (C\(_{D}\)) from 0.5 to 0.3 for a midsize passenger car can improve fuel economy by approximately 23% at a steady speed of 96 km/h (60 mph).
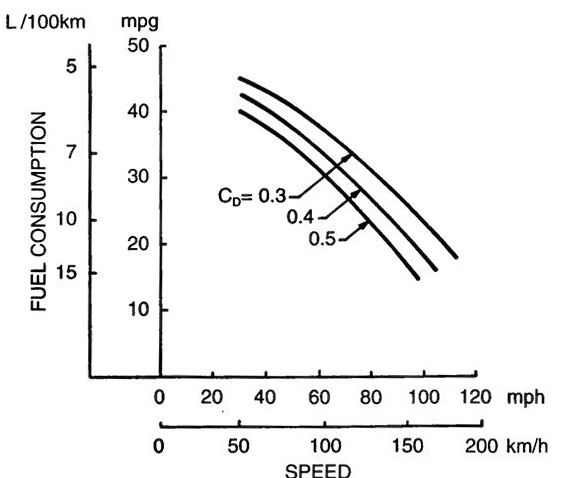
Effect of reduction in aerodynamic resistance coefficient on fuel economy at different speeds for a midsize passenger car.
Aerodynamic Lift : This force, caused by pressure differences across the vehicle body (bottom to top), can reduce the normal load on the tires. This adversely affects the vehicle’s performance characteristics, as well as its directional control and stability. For racing cars, additional aerodynamic surfaces are often used to generate a downward force, increasing tire-ground contact and improving cornering and tractive capabilities.
Aerodynamic Pitching Moment : This moment arises from the resultant of aerodynamic resistance and lift about the vehicle’s center of gravity. It can cause significant load transfer between axles at moderate and higher speeds, influencing performance, directional control, and stability.
Reducing Aerodynamic Resistance in Design
Optimizing vehicle architecture and design is crucial for minimizing aerodynamic resistance. Designers aim to balance engineering, aesthetics, and societal impact. Packaging plays a key role, with different vehicle types having unique design philosophies to achieve specific functional objectives and aerodynamic properties.
- Body Shape Optimization : The single greatest potential for reducing aerodynamic resistance lies in optimizing the vehicle’s body shape. It is estimated that the component of the aerodynamic resistance coefficient due to body shape can be reduced from a typical value of 0.28 to a practical minimum of 0.1, leading to an overall reduction of approximately 55% in total aerodynamic resistance for a typical modern car.
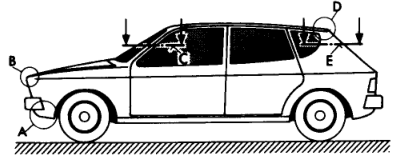
Influence of body shape details on aerodynamic resistance coefficient of a passenger car.
- Forebody and Afterbody Design : The shapes of both the front (forebody) and rear (afterbody) of a passenger car have a significant effect on the aerodynamic resistance coefficient. Designs like the 1934 Chrysler Airflow pioneered the use of aerodynamics and “cab-forward” design to achieve a more efficient form.
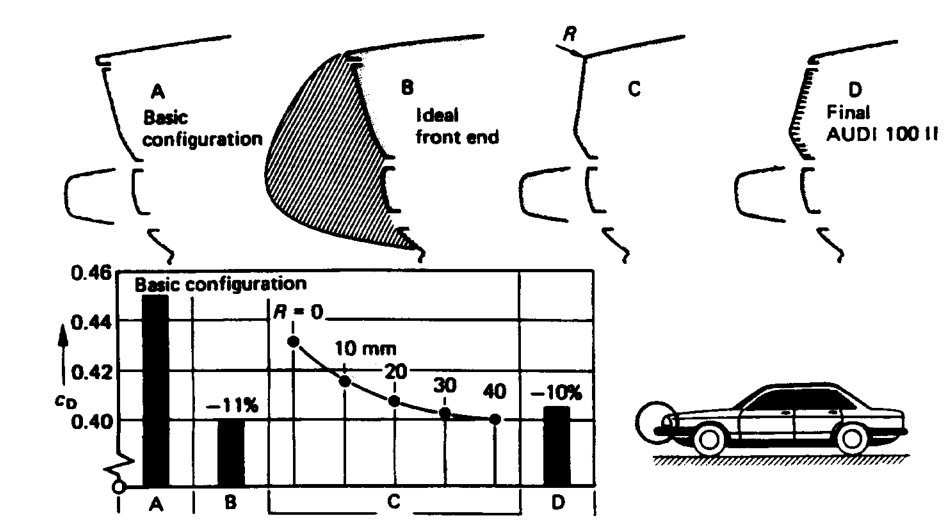
Influence of the shape of the front end and rear end on aerodynamic resistance coefficient of a passenger car.
- Ground Clearance : The distance between the vehicle and the ground affects aerodynamic resistance. Figure 1.4 suggests that reducing a vehicle’s ground clearance can lead to a reduction in aerodynamic drag, and this effect is enhanced when combined with various aerodynamic modifications such as spoilers, air-dams, and wheel-covers. The “all” configuration, which combines these elements, provides the most favorable aerodynamic performance in terms of reduced drag as ground height is decreased.
![]()
Influence of ground clearance on aerodynamic resistance coefficient of passenger cars .
Component Integration : Design elements such as wheel-wells, drip-rails, window recesses, external mirrors, and mud-flaps all impact the aerodynamic resistance coefficient. Efficient design integrates these elements to reduce drag.
Add-on Devices : Spoilers (front and rear) are often used to improve aerodynamic performance. For heavy commercial vehicles, air deflectors mounted on the roof of the tractor or truck can significantly reduce aerodynamic resistance (e.g., up to 24% reduction). Rounded vertical edges and smooth, flat panels on the trailer body also contribute to reductions, especially when coupled with effective air deflectors. However, gap seals between the tractor and semitrailer might not cause a noticeable decrease.
Overall Proportions and Vehicle Type : Different vehicle types inherently have different aerodynamic characteristics due to their functional objectives and resulting proportions. For example, sports cars are designed for the lowest driver height and center of gravity for handling, which also contributes to their aerodynamic profile. Minivans emphasize maximum interior volume and efficient packaging of occupants. The architecture of vehicles like the VW Beetle (The People’s Car) and the BMC Mini demonstrates how logical, basic architecture can lead to enduring designs.
Efficient vs. Inefficient Design Elements : Good aerodynamic design involves features like a raked windshield, small streamlined mirrors, a low raked front end, sharp deck cut-off, tight wheel-to-body relationships, small vents in wheel covers, and a smooth underbody. In contrast, inefficient designs may have large flat mirrors, an upright windshield, large wheel arch openings, a tall upright front end, rough grille contours, and exposed underbody components.
Calculation of Aerodynamic Resistance
In practice, the aerodynamic resistance (\(R_{a}\)) is usually expressed by the following form: \[R_{a}=C_{D}A_{f}V_{r}^{2}\] Where:
\(\) (rho) is the mass density of the air. This value is affected by atmospheric conditions; for instance, an increase in ambient temperature or altitude will cause a reduction in air density, and thus a reduction in aerodynamic resistance. Standard conditions for testing are typically 15\(^{}\)C (59\(^{}\)F) and 101.32 kPa (14.7 psi) barometric pressure, with a mass density of 1.225 kg/m\(^{3}\).
\(C_{D}\) is the coefficient of aerodynamic resistance (also known as the drag coefficient). It represents the combined effects of all factors influencing aerodynamic drag, primarily the vehicle’s shape.
\(A_{f}\) is the characteristic area of the vehicle , usually taken as the frontal area. This is defined as the projected area of the vehicle in the direction of travel. For passenger cars, the frontal area typically ranges from 79-84% of the area calculated from the overall vehicle width and height.
\(V_{r}\) is the speed of the vehicle relative to the wind.
Testing Aerodynamic Resistance
Wind Tunnel Testing
The coefficient of aerodynamic resistance (\(C_{D}\)) is typically obtained through wind tunnel testing. This can be done using either scale models or full-size vehicles.
Scale Models : Often used due to their comparative inexpensiveness and convenience for shape modifications. Common scales are 1/8 in the United States, 1/4 or 1/5 in Europe for passenger cars, and 1/2.5 for commercial vehicles.
Full-Size Vehicles : Avoids scaling problems but requires large and expensive wind tunnels.
Key Considerations in Wind Tunnel Testing :
Flow Field Similarity : It is crucial to ensure that the flow pattern in the wind tunnel is similar to that under actual driving conditions. A basic requirement for scale models is that the Reynolds Number (RN) for the model must equal that for the full-size vehicle. This implies that a 1/8 scale model should be tested at 8 times the speed of the full-size vehicle. Additionally, the blockage ratio (ratio of the model’s frontal area to the wind tunnel test section’s cross-sectional area) should be as small as possible, ideally not exceeding 5%.
Ground Plane Modeling : In a conventional wind tunnel, a boundary layer builds up on the tunnel floor, which can significantly affect the airflow under the test vehicle. To mitigate this, a moving ground plane is often employed to simulate the relative motion between the vehicle and the road accurately.
Road Testing (Coastdown Method)
The deceleration method, also known as the coastdown test , can also be used to determine aerodynamic resistance.
The vehicle is accelerated to a certain speed, preferably its top speed.
The driveline is disconnected from the engine, and the vehicle is allowed to decelerate freely.
Variations in vehicle speed and/or distance traveled with time are continuously recorded.
The deceleration due to the combined effects of rolling resistance, driveline resistance, and aerodynamic resistance is derived from the collected data.
To isolate aerodynamic resistance, the effects of rolling resistance and driveline resistance must be separated from the total resisting force. This can be achieved by:
Conducting an additional road test with a shrouding trailer : The test vehicle is fully enclosed within a “shrouding trailer” to eliminate aerodynamic forces, while its tires maintain contact with the road. A load cell measures the towing force, which represents the sum of rolling resistance and driveline resistance.
Following the SAE Recommended Practice S1263 (SAE International 2010): This procedure allows for the deduction of aerodynamic resistance and the combined tire rolling resistance and driveline resistance from coastdown test data.
Advantages and Disadvantages of Coastdown Method :
Advantages : Does not require expensive facilities like a wind tunnel.
Disadvantages : Requires a straight and level road (grade typically not exceeding 0.5%) and is susceptible to the influence of ambient conditions (e.g., wind).
Reducing Aerodynamic Resistance in an Already Owned Car
The provided sources primarily focus on the principles of automotive design and packaging for new vehicle development. While they do not extensively detail methods for owners to modify their existing cars for aerodynamic improvement, some operational factors are mentioned that can influence aerodynamic resistance:
Closing Windows : Operational factors like whether windows are open or closed affect the aerodynamic resistance coefficient. Therefore, keeping windows closed when traveling at speed can help reduce drag.
Loading Conditions : The loading conditions of a vehicle and the distribution of load among axles can change the vehicle’s attitude (angle of attack) and ground clearance, thereby influencing the aerodynamic resistance coefficient. This implies that minimizing unnecessary external loads (e.g., roof racks, cargo boxes) or optimizing their placement when in use, could potentially offer minor benefits.
Beyond these operational considerations, significant reductions in aerodynamic resistance on an already owned car would typically require structural or body modifications, such as adding aftermarket spoilers or modifying underbody elements. These are complex design considerations touched upon in the sources for new vehicle development (e.g., effects of spoilers, body shape optimization), rather than consumer-level modifications. It is important to note that information on specific aftermarket modifications for consumer vehicles is outside the scope of the provided sources.
References
Hucho, Wolf-Heinrich. 1998. Aerodynamics of Road Vehicles. 4th ed. SAE International.
SAE International. 2010. Road Load Measurement and Dynamometer Simulation Using Coastdown Techniques. SAE International. https://doi.org/10.4271/J1263_201003.
Wong, J. Y. 2001. Theory of Ground Vehicles. 3rd ed. Hoboken, NJ: John Wiley & Sons.