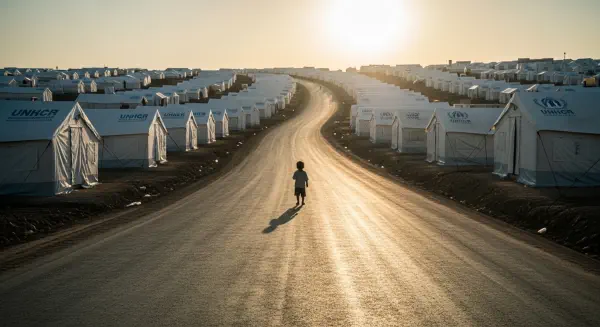
A five-part series examining the system-level failure hidden behind displacement statistics: 117 million people forcibly displaced worldwide, a median exile duration exceeding 20 years, and an international framework built around a crisis it was never designed to make permanent.
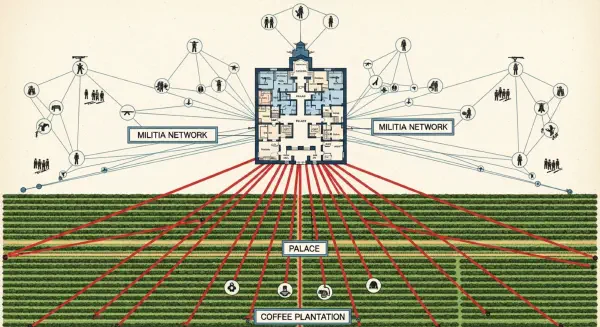
A five-part series using Wintrobe's loyalty-repression model and Verwimp's commune-level data to show that the Rwandan genocide was not the explosion of ancient hatreds but the rational outcome of a budget constraint the dictator could no longer meet.
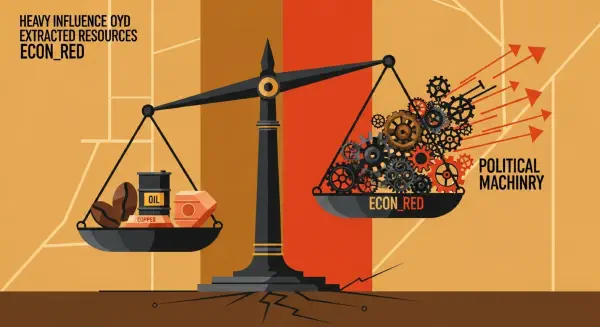
A five-part series examining why the countries best endowed with natural resources are so frequently the worst governed, and how the arithmetic of commodity dependence — not culture, not climate, not colonial history alone — explains the pattern.
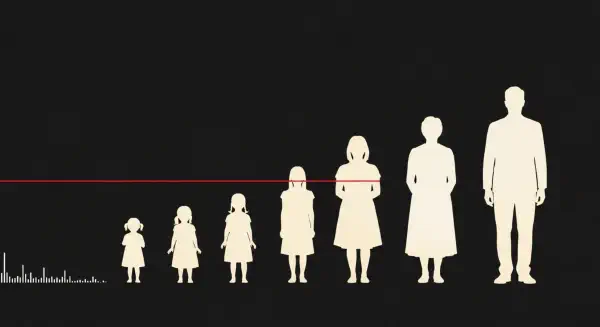
A four-part series tracing the arc from Cold War-era academic optimism about declining conflict, through 25 years of contradicting data, to two new metrics — the Human Cost Index and Casualty Rate — that expose the true human cost and velocity of asymmetric modern war.
Rwanda killed 800,000 people in 100 days. Gaza has killed more than 75,000 in 2.5 years. The numbers are not the same — but the Casualty Rate metric reveals that the mechanism is. This post introduces the velocity of killing as the field's most urgent missing variable.
On January 5, 2025, the Lancet estimated that 75,200 people had been violently killed in Gaza since October 7, 2023. The UCDP ranked that conflict eighth in its 2024 deadliest table. Both numbers are correct. The problem is what they hide.
UCDP v25.1 covers armed conflict through 2024. Supplemented with verified data from 2025 and 2026, it tells a story the optimists of 2002 did not foresee: the S-curve has reversed, and the mechanisms they trusted have proven insufficient.
In 2002, the most comprehensive armed conflict dataset ever built said war was in decline. SIPRI agreed. The UN agreed. The evidence was genuinely compelling — which is what makes what came next so important to understand.