The Aircraft That Gained a Third of Its Weight After Design Freeze#
In 1966, Lockheed began preliminary design on the C-5 Galaxy strategic airlifter under a USAF contract. The specifications called for a maximum payload of 120,000 pounds (54,430 kg), a range of 2,500 nautical miles with maximum payload, and a maximum takeoff weight not exceeding 728,000 pounds (330,220 kg). When the C-5A entered service in 1969, its maximum takeoff weight was 769,000 pounds (348,812 kg) — approximately 5.6% above specification. This was attributed in part to structural reinforcement required after wing fatigue cracking was discovered during testing. During the first decade of operational service, fatigue cracking in the wing box structure required a modification program that added approximately 15,000 pounds (6,800 kg) of structural reinforcement per aircraft. The C-5B series, delivered in the 1980s, incorporated a substantially redesigned wing that was heavier than the specification had anticipated.
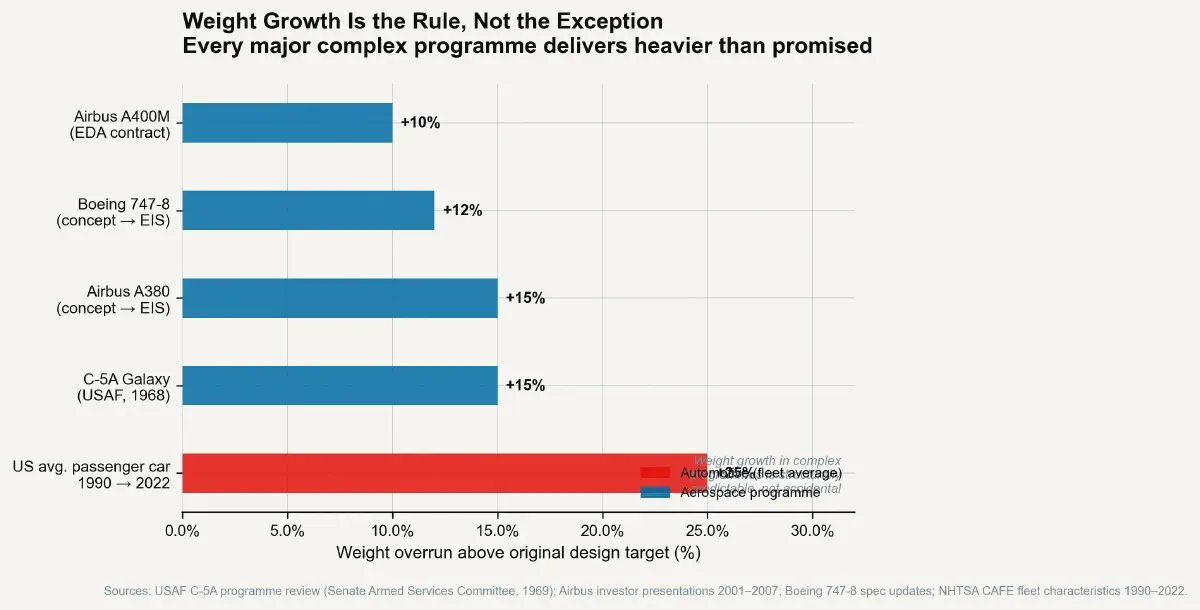
The C-5’s weight growth history is typical, not exceptional. The Airbus A380, conceived in the mid-1990s as a 590-seat high-density double-deck aircraft, entered service in 2007 at an operating empty weight approximately 15% above the targets set during concept phase. The Boeing 747-8, derivative of the 1960s-era 747 design, entered service in 2011 at an operating empty weight that was approximately 12% heavier than initial projections. The Airbus A400M military transport, under development from 2003 to 2013, entered service at a fuel consumption and structural weight that significantly exceeded the performance guarantees in the original contract, resulting in a contract renegotiation that cost Airbus approximately $3.5 billion.
Weight growth in design programs is so consistent that it has its own engineering heuristic: designs typically end development approximately 15–20% heavier than the initial weight estimate, with a standard deviation that has changed little over 60 years of aircraft program history.
Why Weight Growth Is Structurally Inevitable#
The Snowball Dynamics of Early Design Decisions#
A structural design begins with an assumed operating empty weight. From that assumed weight, structural load cases are derived, structural dimensions are sized, material specifications are set, and fastener, sealing, and surface treatment requirements are cascaded. Each of these elements is specified against its own sub-system requirements, validated in isolation, and submitted to the configuration management process that keeps the design consistent.
The problem is that the initial weight estimate is an assumption, not a measurement. Early design phase weight estimation for complex vehicles is accurate to approximately ±15–20% for entirely new configurations. The structural teams that depend on the weight estimate to size load-bearing elements are therefore designing against a number that may be significantly lower than the actual vehicle weight. When the weight estimate is subsequently revised upward — as it almost invariably is, as subsystems detail design replaces preliminary estimates with actual calculated weights — the structural elements sized to the earlier estimate are no longer adequate and must be revised upward. Each upward structural revision itself adds mass, which updates the load case assumptions, which drives further structural revision.
This positive feedback loop — the structural mass spiral — is not primarily a result of poor estimating or inadequate design discipline. It is a consequence of the sequential nature of complex system design: detailed knowledge of actual weights accumulates more slowly than design commitments require, so commitments are made against uncertain estimates, and corrections propagate as a compounding series of additions.
Features Added After Design Freeze#
A secondary driver of weight growth is the addition of requirements and features after design baseline has been established. In commercial aircraft development, the sales process runs concurrently with design: launch customers negotiate customisation options — seat configurations, avionics packages, cargo handling systems — that become certified standard offerings, adding weight that was not in the initial configuration baseline. The Boeing 777 program managed this through a formal “contractual weight guarantee” program with launch customers, backed by performance penalties, that disciplined the engineering teams against weight growth above agreed milestones. Even with this discipline, program weight targets for the 777-200 were revised upward during development by approximately 3–4%.
Military programs add weight through requirement evolution during development, a pattern so common in US DoD acquisition that it has its own terminology: requirements creep. The V-22 Osprey tilt-rotor aircraft, which began development in the mid-1980s, was approved for full-rate production in 2005 — approximately 15 years after its original scheduled initial operating capability — after a development history that included multiple weight growth crises, two fatal crashes attributing structural and aerodynamic factors to weight-driven performance shortfalls, and a restructuring of the program in 1992 that reset performance requirements to reflect achievable physics.
Ground Vehicle Programs and the EV Weight Problem#
Automotive programs exhibit the same structural mass spiral, though the starting point is different: vehicle body structure must be designed around a set of passenger compartment dimensions that are commercially driven (interior space is a core customer attribute) and safety requirements that define minimum structural dimensions for crash performance. In a battery-electric vehicle, an additional structural requirement exists that is absent from an ICE vehicle: the floor-mounted battery pack.
An ICE vehicle’s floor is structurally simple — a pressform steel or aluminium panel serving primarily as a surface. A BEV’s floor is a structural load-bearing enclosure that must protect the battery from intrusion in front, rear, and side impact events; provide sealed thermal management connections; include cooling plate integration; support the battery’s weight (480 kg in the Model Y case) in operational loading and crash loads; and maintain dimensional stability across temperature cycles that could compromise sealing and electrical connections.
The structural overhead of the BEV floor-battery integration adds mass that the MAF calculation must account for. In the Tesla Model Y skateboard platform, structural analysis by teardown engineering firms (including Munro & Associates) estimates that the battery floor assembly’s structural reinforcement — castings, sill reinforcement, internal longitudinal members, and battery housing structures — adds approximately 80–120 kg over what an equivalent ICE-platform floor structure would require. This is the structural mass spiral in a static form: the battery’s mass requires structural accommodation, which adds mass, which in turn adds road load, which adds tire and brake wear.
The Weight That Gets Added and Never Removed#
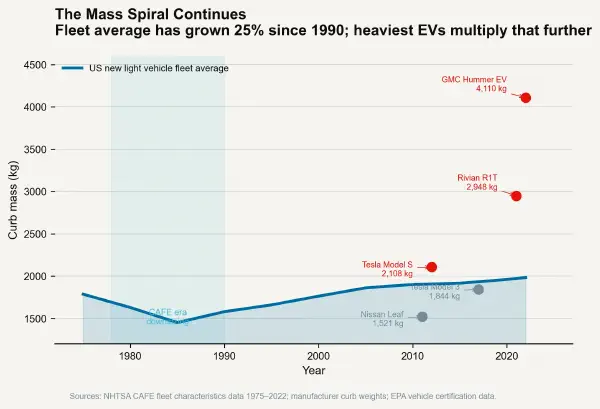
The weight history of production vehicle programs confirms this spiral. The US National Highway Traffic Safety Administration vehicle weight data shows that the average weight of a new passenger vehicle sold in the United States increased from approximately 1,580 kg in 1990 to approximately 1,980 kg in 2022 — a 25% increase over 32 years during which fuel economy regulation was nominally tightening. The weight increase absorbed approximately 50% of the fuel economy improvement that powertrain efficiency gains had generated — mass growth partially neutralised the engine improvements.
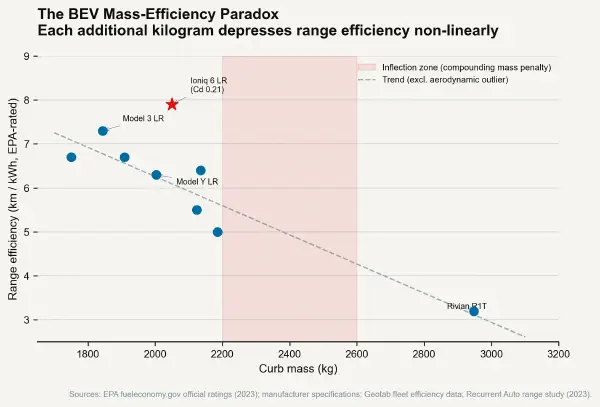
For EVs, the weight trend is more acute. The Tesla Model Y weighs approximately 2,003 kg at curb weight. The Rivian R1T electric pickup, with a 135 kWh battery, weighs approximately 2,948 kg. The F-150 Lightning, with the extended-range 131 kWh battery, weighs approximately 2,810 kg. The GMC Hummer EV weighs approximately 4,110 kg — comparable to the gross vehicle weight of a medium-duty commercial truck from the early 2000s.
These weights produce real-world efficiency consequences. Federal Highway Research Program data shows that road surface deterioration is proportional to the fourth power of axle load (the “fourth power law”). The introduction of large numbers of 2,800–4,000 kg passenger EVs onto road surfaces designed and maintained for average vehicle weights of 1,800–2,200 kg will require proportionally higher maintenance expenditure than the electrification transition’s policy projections have generally accounted for. The external cost of mass growth is being warehoused in deferred road maintenance budgets. The next post examines the specific inflection point where EV mass growth turns against range, and what the data from the best-selling BEV models shows about where the fleet currently sits relative to that inflection.