The Lawyer's Water and the Hydrologist's Water#
In 1922, seven US states gathered at Santa Fe, New Mexico, to negotiate the Colorado River Compact — an agreement dividing the Colorado River's flow between the Upper Basin states (Colorado, Utah, Wyoming, New Mexico) and the Lower Basin states (Arizona, California, Nevada). The negotiators, working from streamflow measurements taken during an unusually wet decade that turned out to be the wettest twenty-year period in the Colorado's 1,200-year reconstructed flow record, allocated a total of 18.5 million acre-feet per year between the basins plus Mexico. Subsequent hydrological studies established the Colorado's long-run average natural flow at approximately 13.5–15 million acre-feet per year. The 1922 Compact allocated approximately 2–5 million acre-feet per year more water than the river produces on average. It was a legal agreement written against a hydrological fiction, and it has been governing the most intensively managed river in the world from that fiction ever since.
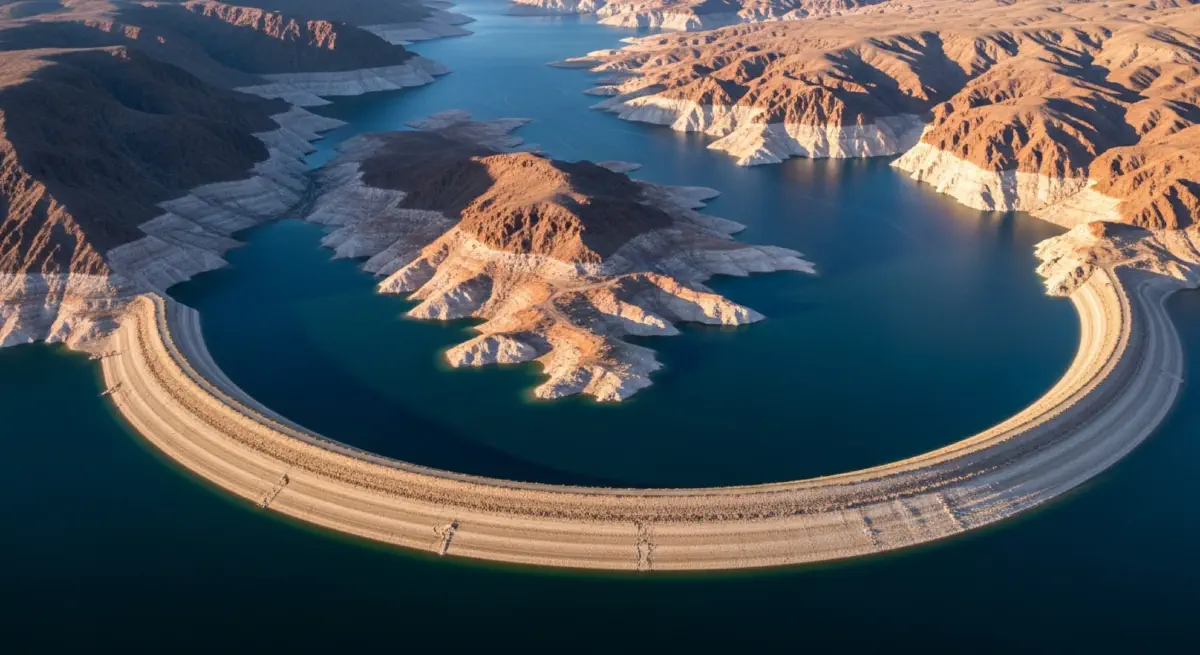
By 2000, Lake Mead — the Colorado's primary storage reservoir behind Hoover Dam — held approximately 98% of capacity. By August 2022, it held approximately 27% of capacity, the lowest level since its initial filling in the 1930s. The Bureau of Reclamation declared the first-ever Tier 2A shortage, triggering mandatory reductions in Arizona's Colorado River allocation. The arithmetic of the Colorado's over-allocation had been known to hydrologists for decades; the legal and political structures allocating the river had not adjusted. The Water Productivity Gap — the inefficiency of water use at the farm and municipal level — had been widened by an institutional structure designed not to price water at scarcity but to distribute existing legal entitlements at historically low cost. The Colorado is not unusual. It is the model.
The Economics of Unpriced Rivers#
Why Water Is Systematically Underpriced#
Water prices in agricultural settings globally reflect three structural factors that systematically produce underpricing: infrastructure cost recovery rather than resource value, historical allocation rights that predate modern scarcity, and political economy. In the American West, water rights systems date predominantly from the doctrine of prior appropriation — first in time, first in right — established in the mining camps of the California Gold Rush and codified in state law during the 1870s–1890s. The prior appropriation system made water access a function of chronological seniority rather than efficient use: the oldest claimed water right takes water first in any shortage, regardless of what the water is used for or how efficiently it is applied.
Under this system, a farmer irrigating alfalfa (water requirement approximately 900–1,200mm/season, WPG approximately 0.3–0.5 kcal/L) with a 1902 water right takes water before a city with a 1970 water right, regardless of the relative economic value of the two uses. The economic inefficiency of this allocation is measured by the opportunity cost of maintaining low-value uses on high-seniority water rights: economic analyses of American West water markets estimate that approximately 80% of all consumptive water use occurs in agriculture, with irrigation water generating approximately $100–300/acre-foot in direct farm value. Urban and industrial uses typically value the same water at $500–3,000/acre-foot. The WPG in economic terms — the gap between the value the water generates in its current use and the value it would generate in its highest-valued alternative use — is approximately 5–15× for agricultural versus urban uses in Western US markets.
The solution market economists propose is water trading: allowing senior agricultural rights holders to sell or lease water to higher-value urban and industrial users. California's 1994 water bank and subsequent Environmental Water Act created legal structures for water trading. The Colorado River Basin has active informal markets. Chile implemented full tradable water rights under its 1981 Water Code. The results of market-based water allocation have been substantiatively positive for economic efficiency — water moves toward higher-value uses — but have produced well-documented distributional effects: agricultural communities that sell their water rights lose both the irrigation water and the agricultural economic base it supports, converting farmland to dryland or fallowed ground and displacing rural employment. Water trading solves the productivity problem without solving the community transition problem.
Transboundary Water: The Nile as Case Study#
The Nile River Basin encompasses eleven countries across approximately 3.2 million square kilometres, from the Ethiopian Highlands to the Egyptian Delta. Approximately 85% of the Nile's flow originates in Ethiopia — specifically in the Blue Nile, which rises from Lake Tana and joins the White Nile at Khartoum. Egypt, with almost zero rainfall in its inhabitable portion and a legally guaranteed Nile allocation of 55.5 billion m³/yr under the 1959 Anglo-Egyptian Nile Waters Agreement, irrigates approximately 3.5 million hectares of agricultural land from the Nile and uses the river for approximately 90% of its municipal water supply. Ethiopia's massive Grand Ethiopian Renaissance Dam (GERD) — completed initial filling in 2020, projected full capacity of 74 billion m³ — was constructed without Egyptian agreement and represents the most significant challenge to Egypt's Nile allocation in the modern era.
The geopolitical stakes are existential from Egypt's perspective. Egypt's WPG for Nile water is approximately 2–3 — moderate efficiency — but any significant reduction in Nile flow would require either accelerated WPG improvement (tighter irrigation efficiency), desalination expansion (currently costly), increased virtual water imports, or agricultural contraction. Egyptian officials have repeatedly characterised GERD as a national security threat. Ethiopian officials characterise it as sovereign development rights — the same rights exercised by the United States on the Colorado in the 1930s, by India on the Indus tributaries, by China on the Mekong headwaters. The Nile Basin Initiative, established in 1999 to provide a multilateral governance forum, has not produced a binding water allocation agreement among its eleven members. The transboundary gap — between the water that upstream development claims and the water that downstream populations have historically depended on — is a WPG problem occurring at the scale of a river basin, and its governance tools are two decades behind its physical reality.
The Desalination Arbitrage and Its Limits#
Desalination of seawater — removing dissolved salts to produce freshwater from the ocean's effectively unlimited supply — represents the theoretical solution to water scarcity for coastal populations. Global desalination capacity in 2024 stands at approximately 100 million m³/day, produced by approximately 20,000 facilities in 170 countries. The Gulf states — Saudi Arabia, UAE, Kuwait, Qatar — derive 40–90% of their municipal water from desalination, having built out massive seawater reverse osmosis (SWRO) and multi-stage flash distillation capacity over the past four decades. Singapore meets approximately 25% of its municipal water demand from desalinated water, increasing to a planned 30% by 2025.
The energy cost of SWRO is approximately 3–5 kWh/m³ at state-of-the-art energy recovery efficiency — compared to the energy cost of pumping conventional freshwater of approximately 0.1–0.5 kWh/m³. Large-scale desalination at current energy intensity would require approximately 200–300 TWh/yr of additional electricity to replace 10% of global agricultural water demand — roughly comparable to the total electricity consumption of Australia. At renewable electricity prices approaching $20–40/MWh in the sunniest regions, the cost is approximately $0.06–0.20/m³ — potentially economically competitive with conventional freshwater in water-scarce coastal regions. But desalination cannot substitute for agriculture's inland water demand: water weighs 1 tonne per cubic metre, and piping desalinated water 500km inland at agricultural scale is prohibitively expensive.
The Ledger That Needs to Be Opened#
The Water Ledger across the four posts of this series converges on a single systemic conclusion: the global water management system is structurally designed to avoid accurate accounting. Water is allocated by legal priority rather than economic value. It is priced at infrastructure cost rather than scarcity value. It is measured — where it is measured at all — in ways that reveal physical flows but not the economic returns to each cubic metre consumed. The WPG persists not because the gap cannot be closed — Israel demonstrates otherwise — but because the incentive structure created by subsidised water, prior appropriation law, and WPG-insensitive agricultural policy removes the financial signal that would reward investment in efficiency.
The policy instruments that narrow the WPG are known: volumetric water pricing at cost recovery plus scarcity premium; tradable water entitlements with environmental flow minimums; mandatory WPG reporting for significant water users; binding transboundary agreements with quantified allocation frameworks. Each is implementable. Each faces opposition from incumbents who benefit from the current pricing and allocation structure. The Colorado's over-allocation was not a hydrological accident. It was a political choice made in 1922 and re-ratified by every subsequent political generation until the lake was 27% full. The invisible river — the virtual water in every traded calorie, the fossil water in every aquifer-irrigated field — has been flowing for a century without appearing in any ledger. The crisis it is building toward will be very visible indeed.