The Calculation on the Back of a Napkin#
Malin Falkenmark — the Swedish hydrologist who in 1989 defined the water stress threshold of 1,000 cubic metres per person per year that is still used in international water assessments — once described water scarcity as a problem that would arrive in slow motion: too slow for politicians to react to, too fast for infrastructure systems to adapt. Her career was spent trying to make the invisible visible. The water in a river is visible. The water in a wheat field, absorbed root to canopy over a growing season and transpired into the atmosphere, is not. The water required to grow the feed grain for a beef animal over eighteen months is approximately four layers of abstraction from anything a consumer can observe in the finished steak.
In 2002, Arjen Hoekstra published the first systematic food water footprint analysis that connected consumer dietary choices to upstream water demand. A kilogram of beef required, across its full production chain, approximately 15,400 litres of water. A kilogram of rice required approximately 1,670 litres. A kilogram of vegetables approximately 300 litres. A kilogram of legumes approximately 900 litres. These figures varied by production system, climate, and geography — rain-fed beef in temperate grassland has a materially different water footprint than grain-fed feedlot beef in an arid region — but the directional relationships were stable: animal protein required dramatically more water per calorie and per gram of protein than plant protein, and processed food required more than raw ingredients.
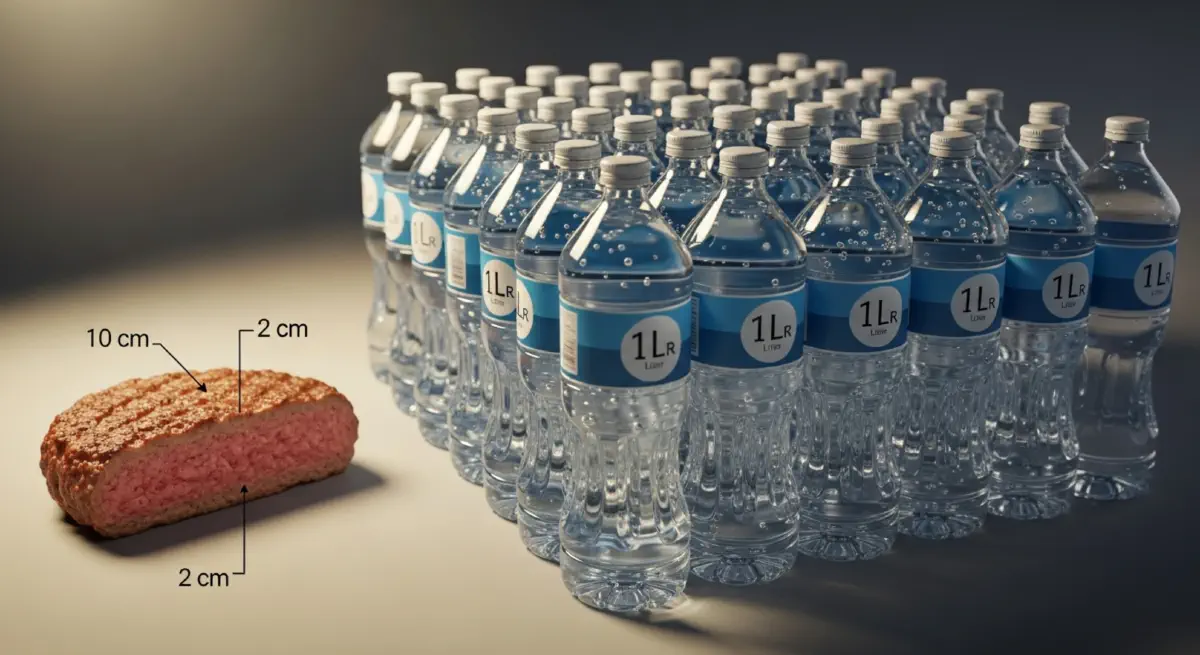
A single 150-gram beef hamburger patty embedded approximately 2,350 litres of water — a number that, when Hoekstra's research was communicated through popular science writing in the mid-2000s, produced the predictable mix of disbelief and rejection. It seemed like an accounting trick. It was not. The Water Productivity Gap (WPG) for beef production relative to legume production — measured as caloric yield per cubic metre of total water consumed — runs approximately 3–5 for legumes versus 0.1–0.3 for beef, a factor of 15–20. Dietary composition is, in the most literal physical sense, water policy.
The Dietary Water Equation#
The Water Footprint Hierarchy of Protein#
The water intensity of food production is governed by two primary factors: the trophic level at which the calorie is consumed (how many feed conversions occur between primary production and the food) and the efficiency of water use at the primary production stage. Animal proteins sit at the second or third trophic level — a cow converts feed grain into meat at an efficiency of approximately 3–10%, meaning 90–97% of the energy and water invested in growing the animal's feed is dissipated as heat, movement, and biological maintenance rather than captured in edible meat. Plant proteins sit at the first trophic level: the water invested in growing the crop is directly captured in the harvested food.
The full production-chain water footprint data, aggregated from Hoekstra and Mekonnen's 2012 PNAS publication covering 196 countries and 402 crop and livestock products, shows a consistent hierarchy. Beef: approximately 15,400 L/kg global average. Sheep: approximately 10,400 L/kg. Pork: approximately 6,000 L/kg. Chicken: approximately 4,300 L/kg. Eggs: approximately 3,300 L/kg. Dairy milk: approximately 1,000 L/kg. Legumes (soybeans, lentils, chickpeas): approximately 900–1,800 L/kg. Cereals: approximately 1,600 L/kg average. Fruits and vegetables: approximately 200–600 L/kg.
Converting these figures to calories — normalising for energy content — sharpens the WPG. Beef delivers approximately 2,500 kcal/kg. Lentils deliver approximately 3,500 kcal/kg. The water cost per 1,000 kcal delivered is approximately 6,200 L for beef, 260 L for lentils — a ratio of approximately 24:1. A person consuming 500 kcal/day of protein predominantly from beef uses approximately 3,100 L/day of embedded water for protein alone; the same protein sourced from legumes uses approximately 130 L/day. Population-scale dietary shifts between these poles — which are already occurring through the global growth of flexitarian, vegetarian, and vegan diets — translate into aggregate freshwater savings measured in hundreds of cubic kilometres annually.
The Israel Model for Closing the WPG#
The most instructive demonstration that the WPG can be systematically narrowed without compromising food production is Israel's agricultural transformation over the past sixty years. Israel receives approximately 90 mm of rainfall per year in its southern Negev region and approximately 600 mm in its northern Galilee — a national average of approximately 450 mm/yr, declining under climate change. Its total renewable freshwater resource is approximately 1.4–1.8 km³/yr, of which approximately 0.75 km³/yr is extracted from the coastal and mountain aquifers feeding Lake Kinneret. This places Israel firmly in severe water stress territory, with per-capita renewable water availability of approximately 150–200 m³/person/yr — among the lowest for any OECD country.
Despite this constraint, Israeli agriculture produces approximately 95% of the country's food requirements and export value of approximately $1.5–2 billion/yr in agricultural products. It does so by operating at a WPG of approximately 1.2–1.5 compared to the regional average WPG of approximately 5–8 — meaning Israeli agriculture extracts 3–5× more food value per cubic metre of water than the regional baseline.
The mechanism is drip irrigation. Developed by Simcha Blass and implemented commercially from the 1960s by Netafim (founded 1966 in Kibbutz Hatzerim), drip irrigation applies water directly to the root zone through a buried or surface-mounted network of pressure-compensated emitters, operating at low pressure and high temporal precision. Water is delivered in response to tensiometer readings of soil moisture tension, eliminating application above field capacity. Combined with deficit irrigation protocols — deliberately maintaining soil moisture below full field capacity during drought-tolerant growth stages — drip-irrigated crops in Israel achieve yield per cubic metre of water 3–5× above flood and furrow irrigation baselines.
The global adoption of drip irrigation has been slower than its WPG advantages would predict. In 2022, approximately 16 million hectares globally were under drip or micro-irrigation — approximately 2% of irrigated cropland. Flood and furrow irrigation, with WPG performance 3–8× below drip equivalents, still covered approximately 90% of irrigated area. The barriers are primarily capital costs (drip system installation is approximately $1,500–4,000/hectare versus near-zero marginal cost for gravity-fed flood irrigation) and institutional: land tenure insecurity that discourages multi-year capital investments, subsidised water pricing that removes the financial incentive for efficiency, and extension services still organised around gravity-fed canal irrigation infrastructure.
The Dietary Transition as Water Infrastructure#
The dietary transition currently underway in high-income countries — driven primarily by health consciousness, environmental awareness, and the economics of plant-based meat products — is substantive in water terms. Globally, per capita beef consumption in OECD countries fell approximately 10% between 2000 and 2020, with significant concentrated declines in the United Kingdom, Germany, and Australia. The UK Climate Change Committee's 2020 Sixth Carbon Budget included a 20% reduction in ruminant livestock product consumption as a required emission-reduction measure; this target simultaneously represents approximately 18–22% reduction per capita in dietary water footprint if achieved.
The water arithmetic of a 20% ruminant reduction for a population of 67 million consuming approximately current levels translates to approximately 15–18 km³/yr reduction in virtual water embedded in UK-consumed food — equivalent to approximately 3× the annual abstraction from England's drought-stressed chalk aquifers. It is not a water policy. It was designed as a carbon policy. The virtual water accounting reveals it has double materiality: both the carbon and the water ledgers improve simultaneously when the dietary composition shifts toward lower trophic levels. The mechanisms that governance structures tend to treat as separate — climate policy, water security, biodiversity, land use — are, in physical accounting terms, often the same mechanism viewed from different disciplinary perspectives. The final post examines the hardest part: the pricing infrastructure, the transboundary agreements, and the institutional architecture that would allow water scarcity to be managed rather than deferred.