The Economist Who Solved a Paradox With a Word#
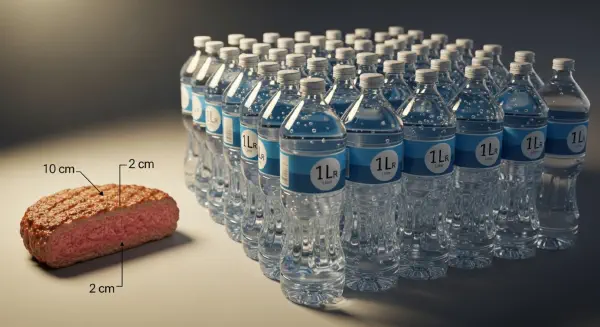
In the spring of 1993, Tony Allan — a geographer at the School of Oriental and African Studies in London — stood at a conference in Stockholm and made an observation that had taken him nearly twenty years to formulate. The water crisis affecting the Middle East was real, he said, but the region was not running out of food. Countries like Egypt, Jordan, and Israel, where annual freshwater availability per capita had fallen below the 1,000 cubic metres per person water-stress threshold, were still feeding their populations. The mechanism was imports. The grain arriving at Cairo and Amman was not just grain — it carried with it the water that had been applied to grow it in the American Midwest, in Argentina, in France. Each tonne of imported wheat represented approximately 1,000 tonnes of water that the importing country did not have to find. Allan called it virtual water.
The term Allan coined in that Stockholm lecture became, over the following decade, one of the most productive analytical frameworks in environmental economics. Virtual water accounting — tracing the total water consumed across the production chain of traded commodities — transformed the study of water scarcity from a purely hydrological question (how much water is physically available?) into an economic question (how is water value flowing through trade, and who is not paying for it?). The Water Productivity Gap (WPG) extends this framework into a production metric: the ratio of best-practice caloric yield per cubic metre of water to national average yield for the same crop. A WPG of 4 means that the country's average irrigation productivity is one-quarter of what the best-practice technology already deployed elsewhere achieves. That gap is the invisible river — water being spent without proportional return.
The Trade Route Nobody Mapped#
What Every Traded Calorie Carries#
The water content of traded food is not visible on any shipping manifest. A container of soybeans moving from Mato Grosso to Guangzhou does not list its water content alongside its weight and nutritional composition. Yet the embedded virtual water in that container is as real a transfer of a scarce resource as a pipeline carrying the water directly. The soybean's water footprint — the total freshwater consumed per tonne of production across its rain-fed and irrigated supply chain — is approximately 2,145 litres per kilogram. A single Panamax bulk carrier loaded with 60,000 tonnes of soybeans is transporting approximately 129 billion litres of virtual water.
Arjen Hoekstra at the University of Twente, building on Allan's conceptual foundation, developed the formal water footprint accounting framework and published the first national-level analysis in 2004. The results were striking. The United States, with its irrigated corn belt and soybean production, was exporting approximately 340 km³ of virtual water per year embedded in agricultural commodities — roughly 7× the annual discharge of the Colorado River. The Middle East and North Africa region, which had been identified as the world's most severely water-stressed major population zone, was importing approximately 50–60 km³/yr of virtual water in food imports — equivalent to the entire annual flow of the Nile. This virtual water transfer was not the product of any deliberate policy. It was the incidental consequence of comparative advantage in the global food trade allocating caloric production to regions with water surpluses.
The WPG for key traded crops reveals both the efficiency of this transfer and its fragility. Global average water productivity for irrigated wheat — measuring how many kilocalories of grain are produced per cubic metre of irrigation water applied — is approximately 580–720 kcal/m³. Drip-irrigated wheat under Israeli conditions achieves approximately 2,800–3,200 kcal/m³. The WPG for global average wheat irrigation relative to best practice is therefore approximately 4–5: the world uses 4–5× more water per calorie of wheat than is demonstrably necessary. Multiplied across the 800 million hectares of irrigated cropland globally, this WPG represents an aggregate water consumption in excess of what optimised irrigation technology would require by approximately 800–1,200 km³/yr.
The Virtual Water Map of Geopolitical Risk#
Tony Allan's insight was most immediately consequential for understanding Middle Eastern food policy. Egypt, Jordan, Israel, Saudi Arabia, and the rest of the region share a common condition: their annual renewable freshwater availability falls below — often dramatically below — the 1,000 m³/capita/yr water stress threshold. Egypt's renewable freshwater availability is approximately 570 m³/capita/yr, predominantly the Nile. Jordan's is approximately 150 m³/capita/yr, among the lowest in the world. Without virtual water imports embedded in food, these populations could not be fed at current densities on domestically producible calories.
The geopolitical implication is that Middle Eastern food security is structurally dependent on the continuation and affordability of global grain trade. A shock to global grain markets — a major drought in the American Midwest, a disruption to Black Sea export routes, an export ban by a major producing nation — translates, in water terms, into an immediate reduction in the virtual water supply available to water-stressed importing countries. The 2007–2008 global food price crisis, in which wheat prices rose approximately 130% over eighteen months following a combination of Australian drought, rising biofuel demand, and speculative purchasing, produced food riots in Egypt, Morocco, and Cameroon. The trigger was financial and agricultural, but the underlying structural condition was virtual water dependency.
Rosegrant and colleagues at IFPRI estimated in 2002 that a 10% reduction in global irrigated crop production — achievable through a combination of competition for water from urban and industrial uses, aquifer depletion, and climate-driven shifts in precipitation — could increase the number of food-insecure people by 40–60 million. The mechanism is not dramatic: not a single catastrophic drought but a gradual tightening of the WPG constraint as the gap between irrigation demand and available freshwater supply narrows.
The WPG as a Production Efficiency Benchmark#
The Water Productivity Gap is operationally useful precisely because it establishes what is achievable. A WPG of 5 for irrigated rice — national average water productivity is one-fifth of the best-practice demonstrated in experimental and advanced commercial settings — does not mean that the average is technically limited. It means the average is economically or institutionally limited. The frontier technology — drip-and-fertigate systems, deficit irrigation protocols, precision soil moisture metering, drought-tolerant variety selection — exists and is deployed at commercial scale in Israel, California, Australia, and the Netherlands. The WPG documents the distance between demonstrated possibility and prevailing practice.
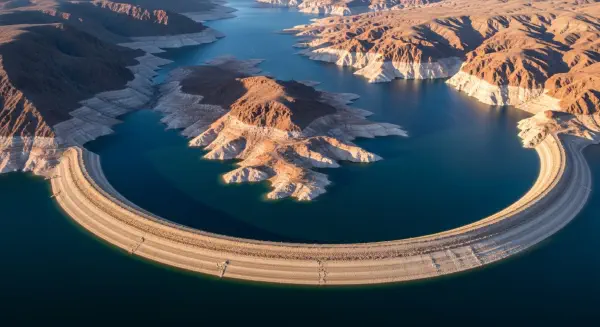
In China's Huang-Huai-Hai Plain, which produces approximately 38% of China's wheat and 26% of its corn from an aquifer system being depleted at approximately 2–4 cm/yr of water table decline, the WPG for irrigated winter wheat is approximately 3–4. Chinese agricultural research programmes at CAAS (Chinese Academy of Agricultural Sciences) have demonstrated yields at WPG ~1.5 through drip-irrigated winter wheat trials. The arithmetic is simple: closing the WPG from 3–4 to 1.5–2 would reduce water demand for Huang-Huai-Hai wheat production by approximately 35–50% — material in the context of an aquifer whose depletion is already affecting groundwater access for 200 million people. The next post examines what happens when a society allows its WPG to persist until the aquifer it was drawing down disappears.
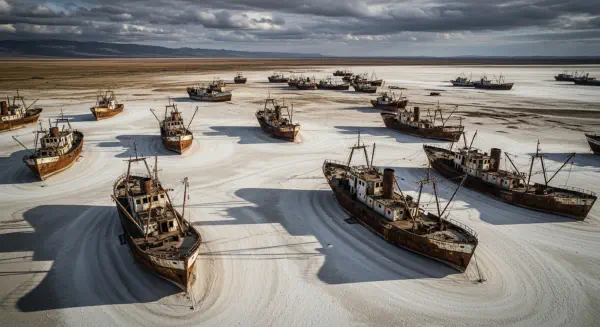
The Account That Cannot Be Overdrawn — Until It Can#
The WPG connects individual irrigation efficiency decisions to civilisational-scale water accounting. Each year a nation's irrigated agriculture operates at a WPG of 4 rather than 1.5, it is consuming roughly 2.5× more water per unit of food output than is demonstrably achievable. For a country drawing primarily on renewable surface water, this inefficiency is economically suboptimal but not catastrophic — the river keeps flowing, the lake keeps refilling. For a country drawing on fossil groundwater — aquifers that are not recharged on human timescales — operating at a large WPG is not merely inefficient. It is accelerating the date at which the water account reaches zero. The geography of that accounting — where the aquifers are, how fast they are being depleted, and what the political economy of water pricing prevents from changing — is the subject of the next post.