The satellite that saw what we didn't want to see#
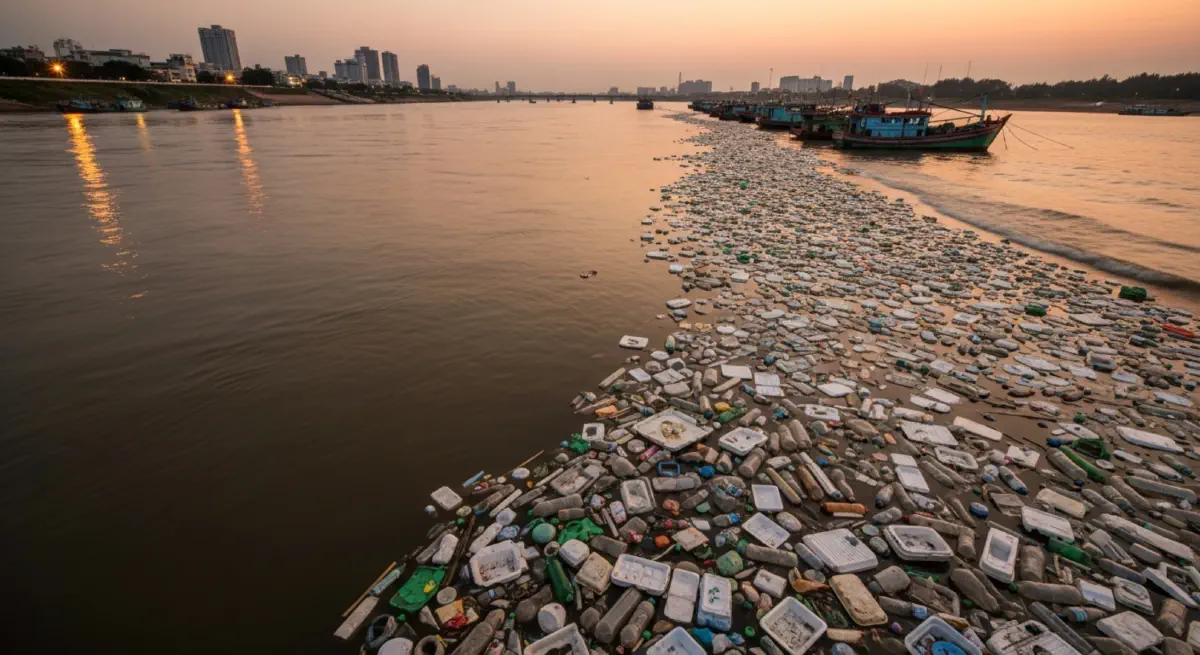
In 2015, four researchers at the University of Georgia — Jenna Jambeck, Roland Geyer, Chris Wilcox, and colleagues — published a paper in Science that attempted to answer a question surprisingly absent from the plastics pollution literature: where, precisely, does ocean plastic come from? The answer required combining coastal population data, national waste generation statistics, waste management infrastructure capacity — the fraction of waste that a country's collection systems actually intercept before it reaches the environment — and proximity to coastlines. Their central estimate: 4.8–12.7 million metric tonnes of plastic entered the ocean in 2010 from land-based sources alone. The midpoint of that range, approximately 8 million tonnes, became the standard citation in subsequent policy and media discussion.
The geographic distribution was the study's most politically consequential finding. The ten rivers delivering the greatest volumes of plastic to the ocean — by a significant margin — were all in Asia. The Yangtze River in China was estimated to be the single largest source; the Ganges, Indus, Yellow, Pearl, and Amur were also among the top contributors. The finding prompted an instinctive political response in Western media and policy discourse: this is an Asian problem, a developing-world waste management failure, something to be addressed through aid and technical assistance rather than through changes to Western consumption or producer responsibility.
This response missed the supply chain that precedes the river.
The topology of a plastic bottle#
A plastic bottle thrown into the Yangtze River in Wuhan did not originate in Wuhan. It originated in a polyethylene terephthalate (PET) resin manufacturing facility — perhaps in China, perhaps in Indonesia, Saudi Arabia, or the United States. It was blow-moulded into its bottle shape, likely in the same country as the resin plant or an adjacent one. It was filled with mineral water or beverages, transported, sold, consumed, and discarded. The consumer who discarded it may lack access to a formal waste collection service. The municipality in which it was discarded may operate waste collection that covers 40% of households. The 60% not covered deposit their waste in informal sites, from which wind and runoff carry it to the nearest waterway.
The Plastic Cost Coverage Ratio reflects this supply chain topology. The producer who manufactured the PET resin is the entity that captured the economic value of plastic production while externalising its end-of-life costs. In a country without EPR — which is most of the countries where the highest-input rivers are located — the producer's PCCR is precisely zero: no end-of-life obligation, no levy, no take-back requirement. The external cost is borne entirely by the municipality (where collection exists), the informal waste picker (where it doesn't), and ultimately by the ocean ecosystem.
The infrastructure gap is real and important. But framing ocean plastic as a waste management problem in developing economies, without addressing the production-side economics that generate the waste, is the plastic equivalent of treating climate change as a developing-world energy poverty problem without addressing the fossil fuel production subsidy structures that make carbon-intensive energy cheap.
The Yangtze versus the supply chain#
The Yangtze River basin has a population of approximately 460 million people. The river and its tributaries drain a catchment that includes approximately 40% of China's GDP, some of the world's most intensive manufacturing capacity, and megacities including Chongqing, Wuhan, Nanjing, and Shanghai. China is the world's largest producer of plastic resin (approximately 32% of global production), the world's largest plastic goods manufacturer, and the world's largest plastic consumer.
China's municipal waste management infrastructure, while dramatically improved in the 2010s through the National Sword waste sorting policy (which paradoxically reduced recycling of some categories by eliminating the informal collection systems that had operated previously), remains incomplete at the urban fringe and in rural areas. The fraction of plastic waste in China reaching the formal collection and recycling system is estimated at approximately 40–50% — well above the world average of approximately 20%, but generating substantial residual leakage through the largest production and consumption system in the world.
The Lam Bui and colleagues 2020 analysis in Science attempted to model the complete global plastic system, including waste trade flows, and found that the ocean plastic input figure was better understood as a function of two simultaneous variables: per-capita plastic consumption (highest in rich countries) and waste management infrastructure coverage (inversely correlated with per-capita income at low to middle income levels). High-income countries generate substantially more plastic per capita but intercept it more effectively. Middle-income rapidly industrialising economies generate growing plastic volumes before their infrastructure reaches sufficient collection coverage. Low-income countries generate less plastic per capita but have the lowest collection rates.
Under this framing, high-income country plastic production for export to lower-income markets — including the export of plastic-packaged consumer goods from multinational brand owners to distribution channels in countries where post-consumer collection does not exist — contributes to ocean plastic production from rivers that the Jambeck paper's input geography attributes to the local country. The brand owner sells a product in packaging for which no EoL collection exists in the market of sale. The PCCR for that specific product in that specific market is zero.
The garbage patch as reservoir#
The Great Pacific Garbage Patch — the informal name for the accumulation zone in the North Pacific Subtropical Gyre — was first identified scientifically by Charles Moore in 1997, quantified by Moore using surface trawls in subsequent cruises, and systematically mapped by an international Ocean Cleanup project expedition in 2018. The 2018 study by Lebreton et al. in Scientific Reports estimated the Patch contained approximately 80,000 tonnes of plastic across approximately 1.6 million km² — an area approximately three times the size of France.
The 80,000 tonne figure is best understood not as a static accumulation but as a dynamic equilibrium between ongoing input and the loss of particles through photodegradation, ingestion by marine organisms, and eventual sinking to deep-sea sediments. The patch grew by approximately 6% per year between 2005 and 2018, according to the Lebreton analysis. At current input rates — approximately 8–10 million tonnes per year globally — and current degradation and sinking rates, ocean plastic inventory is expected to increase for decades even under aggressive intervention scenarios.
The deep-ocean floor turns out to be a far larger plastic sink than the surface. Studies using sediment cores and deep-sea ROV transects have found microplastic concentrations in deep Pacific and Atlantic sediments that exceed surface concentrations by multiple orders of magnitude — the plastic is not staying at the surface but accumulating on the seafloor, embedded in geological record layers that future geological researchers would, presumably, identify as a marker of the Anthropocene.
The supply chain runs to the bottom#
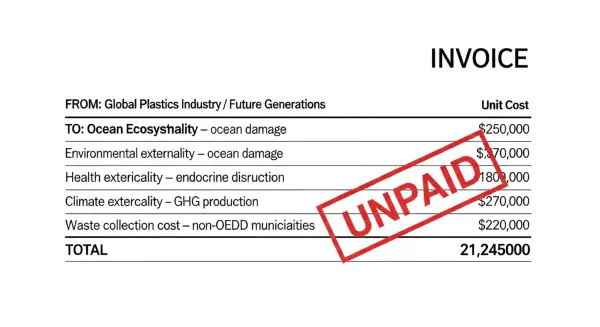
The river that never stops is not primarily a water management problem. It is a cost externalisation problem with a very specific structure: the value of plastic is captured at production and sale; the cost of plastic is deposited at the end of the supply chain, in the ocean, in the sediment, in the marine food web, in the bodies of organisms that cannot distinguish between food and polymer fragment.
The Plastic Cost Coverage Ratio, below 0.05 globally, reflects this structure exactly. The producers who capture the value do not pay the costs. The governments of low-income coastal countries, whose rivers flow to the ocean, face both the cost of collecting plastic they did not produce at the output scale characteristic of wealthy-country consumption, and the political critique that they are the source of ocean plastic because their rivers are the measurable input vector.
The solution that the PCCR framework points to is not a waste management programme targeted at Asian rivers. It is a producer responsibility and levy system upstream of the river — at the point of production and sale — that shifts the cost of end-of-life management back onto the economic actor that captured the value of production, and funds the waste infrastructure in the countries where the products end up in waterways. The next post examines what happens when the plastic has already entered the body — not the ocean's body, but the human one.