The number that stopped a room#
In June 1997, a paper landed in Nature with a figure so large that economists spent the following decade arguing about whether it was even a meaningful statement. Robert Costanza and twelve co-authors from four countries had attempted to price the services that the natural world provides to human civilisation — not the value of commodities extracted from nature, but the value of the ongoing processes that make the planet habitable. Their estimate for the whole of the global ocean: $20.9 trillion per year. For comparison, world GDP in 1997 was approximately $32 trillion. Costanza's number suggested that the ocean was generating roughly two-thirds of everything the global economy produced — but doing so entirely off the books.
The reaction from mainstream economists was sharp. The exercise was methodologically flawed, critics argued. You could not simply aggregate marginal willingness-to-pay estimates across different ecosystem services and sum them to a total, because the ecological conditions that generate those services are not substitutable at the margin. Some critics were right on technical grounds. But their objection missed the point that Costanza was making: not that the number was precise, but that the number was not zero — and most economic accounting was treating it as if it were.
The ocean has a revenue model no one audits#
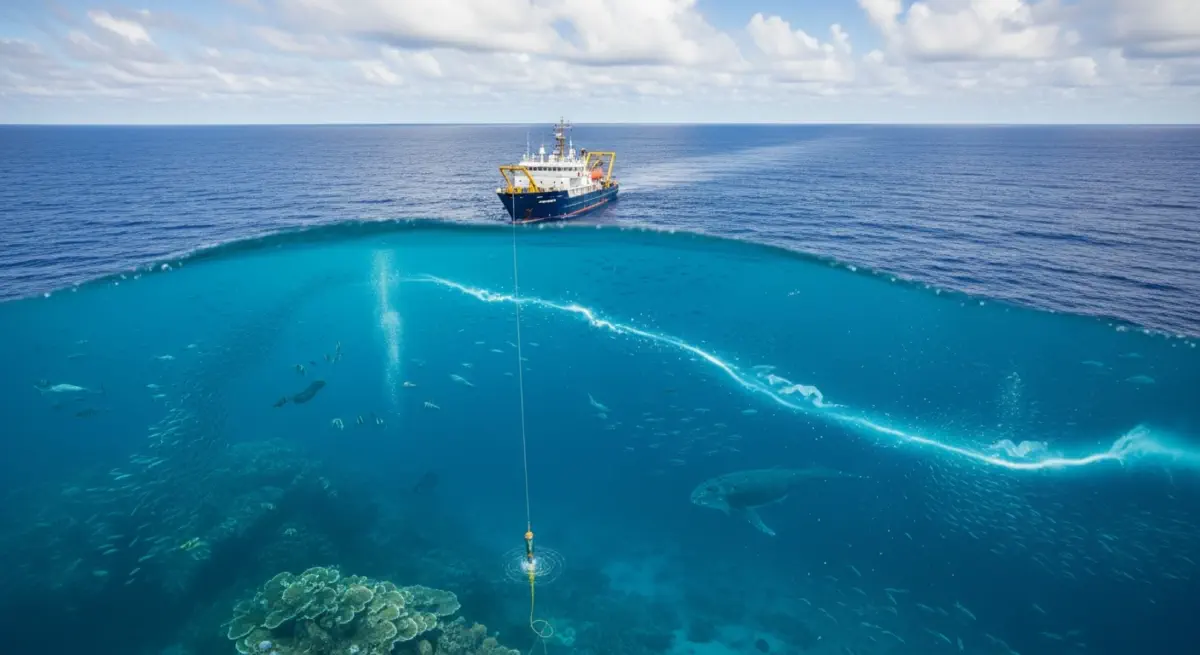
The marine ecosystem is not a passive backdrop to the ocean economy. It is the economy's engine. Every trawler that returns to port with a catch depends on a nutrient cycle, a temperature regime, and a food web that the ocean maintains without charge. Every coastal city that escapes catastrophic inundation from a tropical cyclone owes a portion of that outcome to the attenuation provided by coral reefs, mangrove forests, and seagrass beds — none of which appear on any national balance sheet. The ocean absorbs approximately 25% of annual anthropogenic CO₂ emissions and approximately 90% of the excess heat generated by the greenhouse effect since industrialisation.
These are services. They have economic value. Measured against prices paid for them, they generate revenue of exactly zero.
The Marine Extraction Ratio (MER) makes this accounting gap legible. MER = Annual economic value of marine resource extraction ÷ Annual estimated value of marine ecosystem services. A ratio above 1.0 means extraction exceeds service value — economically impossible on a sustainable basis. A ratio below 1.0 means the ocean generates more value through services than is extracted. The critical insight is not the ratio's magnitude, but its direction of travel: as ecosystem services degrade, the denominator shrinks while extraction volumes are held constant or expanded, driving MER upward toward the point at which the capital stock itself begins to collapse.
What the ocean actually produces#
Costanza's 1997 estimates were revised upward substantially in a 2014 Global Environmental Change paper, where the same team recalculated ocean ecosystem service values using updated land-use data, improved ecological models, and revised unit values. The revised ocean estimate reached approximately $24.6 trillion per year in 1997 dollars, or roughly $49.7 trillion per year in 2010 dollars — larger than global GDP at the time of the revision.
The primary service categories are instructive. Open-ocean services — climate regulation, nutrient cycling, gas regulation, biological production support — account for approximately $17.6 trillion in the 2014 estimates. Coastal ecosystem services — coral reefs, mangroves, seagrasses, estuaries, tidal marshes — account for approximately $25 trillion, despite covering a fraction of the ocean's surface area. The coastal concentration is not surprising: it is precisely the spatial interface between marine and terrestrial systems that generates the highest density of provisioning and regulating services relevant to human populations.
Carbon sequestration alone justifies the accounting exercise. The ocean absorbs approximately 2.5 gigatons of carbon per year — equivalent to the emissions of roughly 1.4 billion passenger vehicles. At the social cost of carbon currently used in US regulatory analysis ($190/tonne CO₂, EPA 2022 interim value), the carbon sequestration service of the global ocean is worth approximately $1.75 trillion per year. This figure does not appear in the accounts of any fishing company, shipping conglomerate, or maritime state.
What we extract and at what price#
Global marine capture fisheries produce approximately 80–82 million tonnes of wild-caught fish and invertebrates per year, relatively stable since the late 1980s. The ex-vessel value of global marine capture fisheries is approximately $130–150 billion per year. Marine aquaculture adds another 90 million tonnes valued at approximately $213 billion (FAO, 2022). The total marine food production industry — extraction plus farming — generates something under $400 billion per year.
That number seems large. Against the ecosystem service value required to sustain it — the nutrient cycling that supports phytoplankton, the temperature regulation that determines fish distribution and reproduction, the habitat services of coastal wetlands that serve as nursery grounds for approximately 70% of commercially important marine species — it is not large. The Costanza team's estimate for fishery support services alone is approximately $1.0–1.6 trillion per year, meaning that the wild fishery captures perhaps ten to fifteen percent of the service value required to generate its catch.
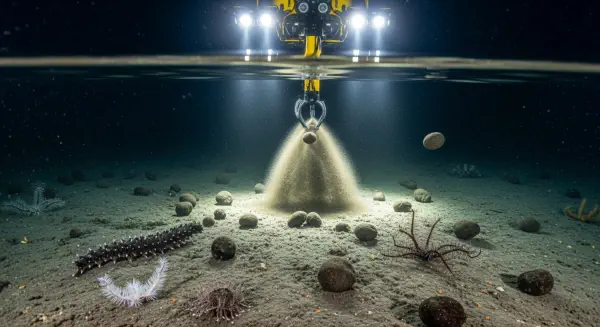
Shipping generates approximately $500–600 billion in annual freight revenues while imposing externalities — ocean noise affecting cetacean navigation, ballast water invasive species introduction, hydrocarbon pollution, antifouling biocide toxicity — that are not priced into freight rates. Deep-sea mining remains in pre-commercial development but has attracted sufficient commercial capital to motivate the allocation of approximately 1.5 million km² in exploratory licences. The extraction value sought from those licences is directly proportional to the degree to which the regulatory framework fails to price the ecosystem service value of the seafloor environments that will be destroyed.
Building the Marine Extraction Ratio#
The MER calculation for the current global ocean is conceptually straightforward and practically contested. Extraction value in the numerator can be estimated with reasonable confidence from fishery landing data, shipping revenues, and offshore energy production statistics: approximately $2–2.5 trillion per year for the global ocean economy as conventionally measured. The denominator — the annual flow value of marine ecosystem services — requires the Costanza-type valuation methodology, which carries significant uncertainty ranges.
Using Costanza et al.'s 2014 estimates, the annual service flow value of the global ocean is approximately $25–50 trillion per year (the wide range reflects the genuine difficulty of unit value estimation). This implies a global MER of approximately 0.04–0.10: for every dollar of value extracted, the ocean generates between ten and twenty-five additional dollars in services that are neither priced nor protected by the extraction licensing system.
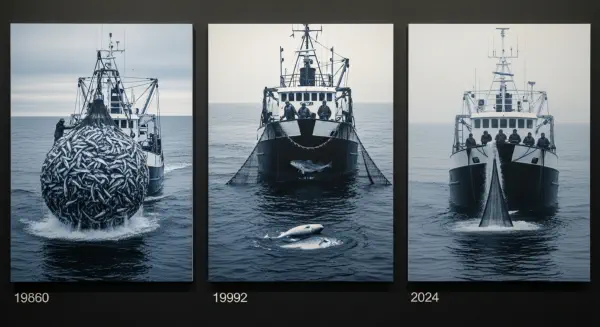
The MER's utility is not in the exact ratio but in what happens to it under different policy scenarios. In the case of the Atlantic cod, the relevant MER — the ratio of extraction value to the biomass-support ecosystem service value of the Northwest Atlantic ecosystem — rose sharply through the 1980s as the nominal catch remained high but required intensifying effort as stocks declined. The service value of the ecosystem was falling even as landed value remained superficially stable. The moment of stock collapse in 1992 represented the point at which the extractive numerator had effectively destroyed its own denominator. That destruction, and the fishery collapse that followed, is the subject of the next post.
What the balance sheet was hiding#
The ocean economy is solvent by the only accounting that matters — ecosystem service revenue exceeds extraction revenue by a factor of ten to twenty. But it has been managed as though it were insolvent: as though every unit of productivity were a diminishing asset to extract before someone else extracted it, rather than a perpetual flow from a capital stock that compounds if left intact. The Costanza paper was not a precise appraisal. It was an existence proof, demonstrating that the value was positive, large, and unrecorded.
The implications of leaving those services unrecorded are not theoretical. The Atlantic cod stock was not driven to collapse by ignorance of fish biology. Scientists at the Fisheries Research Board of Canada had produced accurate population models in the 1970s that correctly predicted the trajectory of the fishery under the harvest rates being observed. The models were not wrong. They were not incorporated into quota decisions because the economic signal — the market price of landed cod — provided no information about the ecosystem service value being destroyed in the process of fishing. When the accounting system contains only the revenue from extraction, it will always underestimate the cost of extracting too much.
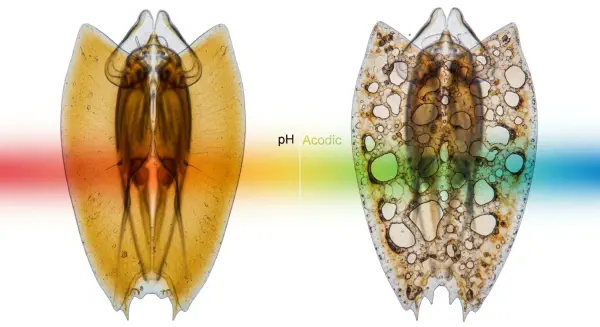
The next chapter of the ocean economy is being written in the same accounting language. Deep-sea mining licences are allocated against royalty frameworks that price mineral royalties but not the ecosystem services of the destroyed seafloor habitats. Carbon sequestration services are not priced in any fishery licence or shipping registration. Ocean acidification is accumulating on a balance sheet that no government has agreed to publish. The arithmetic of the Marine Extraction Ratio does not require precision to be alarming. It requires only honesty about which column you have been reading.
In the next post, the collapse of the Atlantic cod provides the first detailed case study in what happens when the MER for a specific ecosystem component crosses from yield to drawdown — and why the recovery has now taken longer than the fishery itself.