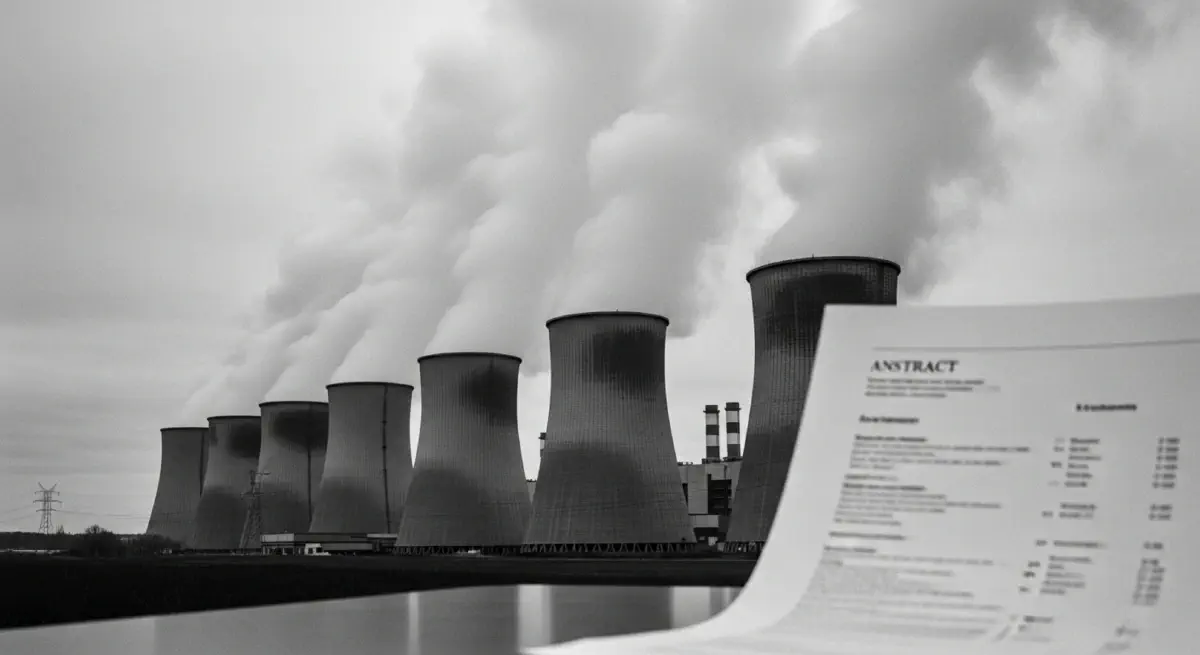
A paper published into silence#
In May 2013, James Hansen and Pushker Kharecha submitted a manuscript to Environmental Science & Technology containing a calculation that had not previously appeared in any major peer-reviewed publication. They estimated that global commercial nuclear power generation had, between 1971 and 2009, prevented approximately 1.84 million deaths by displacing the fossil fuel generation that nuclear had replaced. Their method was standard epidemiological accounting: take the actual electricity generated by nuclear over those four decades (approximately 64 petawatt-hours), model the counterfactual generation mix if nuclear had not existed, apply established dose-response relationships for the air pollution that counterfactual generation would have produced, and calculate the attributable mortality.
Hansen was not a nuclear advocate by professional formation. He was the director of the NASA Goddard Institute for Space Studies, the scientist who had testified to the US Senate in 1988 that he was "99 percent certain" that the planetary warming then being measured was human-caused — a testimony widely credited with putting climate change on the US political agenda. His co-author Kharecha was an atmospheric chemist. Neither had a professional stake in the nuclear power industry. Their calculation was produced by the same method used by the World Health Organization to estimate air pollution deaths globally, and the same method used by cancer epidemiologists to calculate the mortality burden of PM2.5 exposure. It was, in the assessment of the reviewers who approved it for publication, methodologically sound.
The paper appeared in May 2013. It received a fraction of the press coverage devoted to any single year's Chernobyl anniversary coverage. The 1.84 million figure has never appeared in a major policy discussion of nuclear energy's future.
The denominator problem of energy risk#
Every energy source kills. The question that matters for energy policy is not whether a source carries mortality risk — they all do — but how much mortality risk it carries per unit of energy delivered. The Lifetime Risk-Adjusted Carbon Score is a composite index that combines two independently important metrics: lifecycle carbon emissions per kilowatt-hour, and mortality per terawatt-hour generated. By weighting these two risks together and indexing the result against coal = 1.0, the LRACS reveals the full cost profile of each energy technology in a form that makes cross-source comparison explicit.
The index construction uses median lifecycle carbon estimates from the IPCC's 2014 Fifth Assessment Report Annex III, which synthesised hundreds of lifecycle assessment studies to establish the most comprehensive available consensus figures. For mortality, it uses the dataset compiled by Benjamin Sovacool (2008, 2016) and subsequently updated and validated by Our World in Data, which draws on energy accident databases, occupational safety records, and air quality epidemiology to generate deaths per TWh figures for each source type. The combination of low lifecycle carbon and low mortality rate per TWh makes a source low-LRACS; high values on either dimension drive the index upward.
What the LRACS table shows#
The lifecycle carbon estimates are well known to energy analysts, if not to the general public. The IPCC 2014 figures (median values, gCO₂e/kWh): coal 820; oil 720; natural gas 490; solar PV 48; hydropower 24; wind onshore 11; nuclear 12. The range of estimates around the nuclear figure spans approximately 4–110 gCO₂e/kWh depending on assumptions about uranium enrichment methods, plant lifetime, and country-specific electricity grid mix used in construction; the median figure of 12 places nuclear at approximately the same lifecycle carbon intensity as onshore wind, and significantly below solar PV.
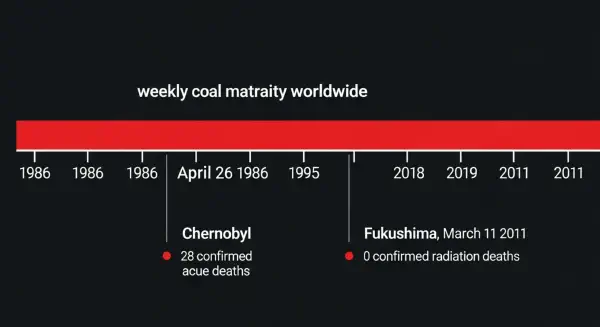
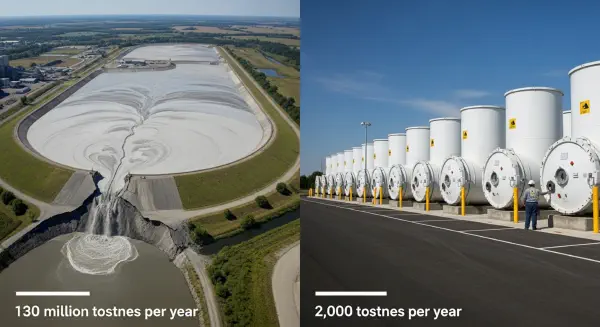
The mortality figures are less familiarly cited but methodologically no less rigorous. Deaths per TWh (Sovacool 2016; Our World in Data/Ritchie 2020): coal 24.6; oil 18.4; natural gas 2.8; biomass 4.6; solar 0.44; wind 0.15; nuclear 0.07. The coal figure incorporates both occupational mining and transport deaths and, dominantly, the 3.6 million deaths per year attributable globally to outdoor PM2.5 exposure from combustion (WHO Global Burden of Disease data), proportionally allocated to coal combustion's contribution to total combustion PM2.5. The nuclear figure incorporates Three Mile Island, Chernobyl, and Fukushima occupational and evacuation deaths, all confirmed radiological fatalities from plant accidents, and mining fatalities, divided by total TWh generated globally over the relevant period.
The LRACS result, indexing to coal = 1.0 by normalising each component separately before combining: Coal = 1.0; Oil ≈ 0.68; Natural gas ≈ 0.19; Biomass ≈ 0.15–0.30; Solar ≈ 0.003; Wind ≈ 0.001; Nuclear ≈ 0.001. Nuclear and onshore wind are effectively indistinguishable at the precision of the underlying data — both are approximately one thousand times safer per unit energy, in the combined carbon-and-mortality metric, than coal.
The visibility asymmetry#
The gap between what the LRACS shows and what public opinion surveys record about perceived nuclear risk is one of the most studied examples of the psychology of risk in the academic literature. Paul Slovic's foundational work on risk perception, developed through the 1970s and 1980s, established the concept of "dread risk" — the category of risks that generate disproportionate fear relative to their statistical frequency. Nuclear power is the archetypal dread risk: the feared outcome (radioactive contamination, acute radiation syndrome, long-term cancer from low-dose exposure) combines high perceived uncontrollability, involuntariness, catastrophic potential, and imagery of invisible contamination. Each element of this combination scores highly on Slovic's "dread" dimension.
The comparison class — the continuous, diffuse, statistically attributable deaths from PM2.5 exposure associated with fossil fuel combustion — is structurally the opposite. Deaths from air pollution are distributed across populations, occur years or decades after the relevant exposure, are not attributed to specific facilities or companies in any causal chain that media can report, and carry no imagery of catastrophe. The deaths happen quietly, in hospital wards and homes, recorded in mortality statistics as heart disease, stroke, and chronic respiratory disease. They are invisible in precisely the way nuclear accident deaths are vivid.
The 3.6 million premature deaths attributable to outdoor air pollution annually (WHO, 2019) generate approximately zero sustained political response of the type that a single nuclear plant incident generates globally. The Fukushima disaster — which, as of the 2020 WHO assessment, has produced no confirmed radiation-induced civilian fatalities and is associated with approximately 2,200 evacuation-related deaths from the displacement of elderly and chronically ill residents — generated a political response in Germany, Switzerland, Japan, and South Korea that has resulted in the retirement of nuclear capacity currently being replaced predominantly by natural gas and coal.
The Hansen number in context#
The 1.84 million lives prevented by nuclear power between 1971 and 2009 is not the largest such estimate in the energy mortality literature. A 2020 analysis by Lucas Davis and Catherine Hausman, using hourly generation data from the US electricity system to estimate the emission consequences of US nuclear plant closures, found that the closure of nine US nuclear plants between 2013 and 2019 was associated with approximately 2,200 additional deaths per year in the US alone from the air pollution consequences of replacement gas and coal generation.
The Hansen and Kharecha figure, when extended to include the coal phase-out dividend from current nuclear capacity, suggests that replacing all current global nuclear capacity (approximately 390 GW) with natural gas would cause approximately 420,000 additional deaths per decade from air pollution — equivalent to the annual death toll of a medium-sized conventional war, sustained indefinitely. This calculation has never been mentioned in a Greenpeace campaign, a German Bundestag debate, a Japanese parliamentary session, or a Swiss referendum pamphlet on nuclear phase-out.
The visibility asymmetry is not accidental or random. It is a direct consequence of the psychological structure of dread risk: vivid, concentrated, fear-generating events trump statistical, diffuse, dread-absent ones in human cognition, media coverage, and political response, regardless of their relative magnitudes. The result is an energy policy landscape in which the safest-per-TWh low-carbon generation technology available at scale is being retired on the basis of a risk framework that would, if applied consistently to fossil fuels, require the immediate elimination of all coal and gas combustion as a catastrophic threat to public health.
What the number means#
The 1.84 million is not a final or precise figure. It carries uncertainty from the dose-response functions applied, from the counterfactual generation mix assumptions, and from the global variation in power plant emission factors. The uncertainty range around the central estimate spans perhaps ±30–40%. The direction of the finding is not in uncertainty.
The nuclear accounting problem is not that the evidence is ambiguous. It is that the evidence is abundant, rigorously derived, and almost entirely absent from the policy conversations in which it is most relevant. The LRACS framework is a tool for integrating that evidence at the level of the energy system rather than the individual plant — for asking not whether a specific reactor has a specific safety record, but what the mortality and carbon cost profile of an entire generation technology is, per unit of delivered energy, compared to its realistic replacement.
The next post in this series examines the three significant civilian nuclear accidents in the historical record and applies the LRACS comparison directly: against the background rate of fossil fuel mortality, what does the Chernobyl death toll weigh?