A number before numbers were kept#
In 1980, Norman Myers published a paper in Science estimating that Earth was entering a period of species loss so rapid that it would rival the five mass extinction events in the geological record. Myers did not have reliable global species inventory data — no one did. He was working from fragmentary evidence: species-area relationships applied to known rates of tropical deforestation, animal surveys in selected ecosystems, and the rate of discovery of new tropical insect species (implying an unknown total far beyond what had been described). His central estimate for the rate of species extinction was approximately 40,000 per year — many times the background extinction rate that had prevailed through the Holocene and Pleistocene.
The scientific community's initial response was scepticism: the evidence base was thin, the extrapolation methods were contested, and the figure was so large that it implied rapid collapse of observable biodiversity that was not, in 1980, obviously visible in the landscapes of well-monitored temperate regions. The subsequent four decades of research has not narrowed the concern — it has expanded and refined it. The IPBES 2019 Global Assessment, drawing on more than 15,000 scientific and government sources assessed by 145 expert authors over three years, confirmed that approximately 1 million animal and plant species were threatened with extinction under current land use and exploitation trajectories. The background extinction rate — derived from the fossil record over geological timescales — is approximately 0.1–1 species loss per million species-years. The current estimated extinction rate is approximately 100–1,000 times that background level.
The capital stock being destroyed#
The Ecosystem Dependency Ratio's denominator — the annual investment in biodiversity protection — is small relative to the numerator for reasons that go beyond political indifference. The numerator itself is being drawn down. The ecosystem service values that the EDR numerator captures are themselves declining as the biodiversity underpinning those services is lost. A falling numerator combined with a declining denominator does not necessarily produce a declining EDR; it depends on the relative rates of change. But it does mean that the leverage the current economy runs on nature is being carried on a shrinking asset base — an asset base whose depreciation is not recorded anywhere in the accounts.
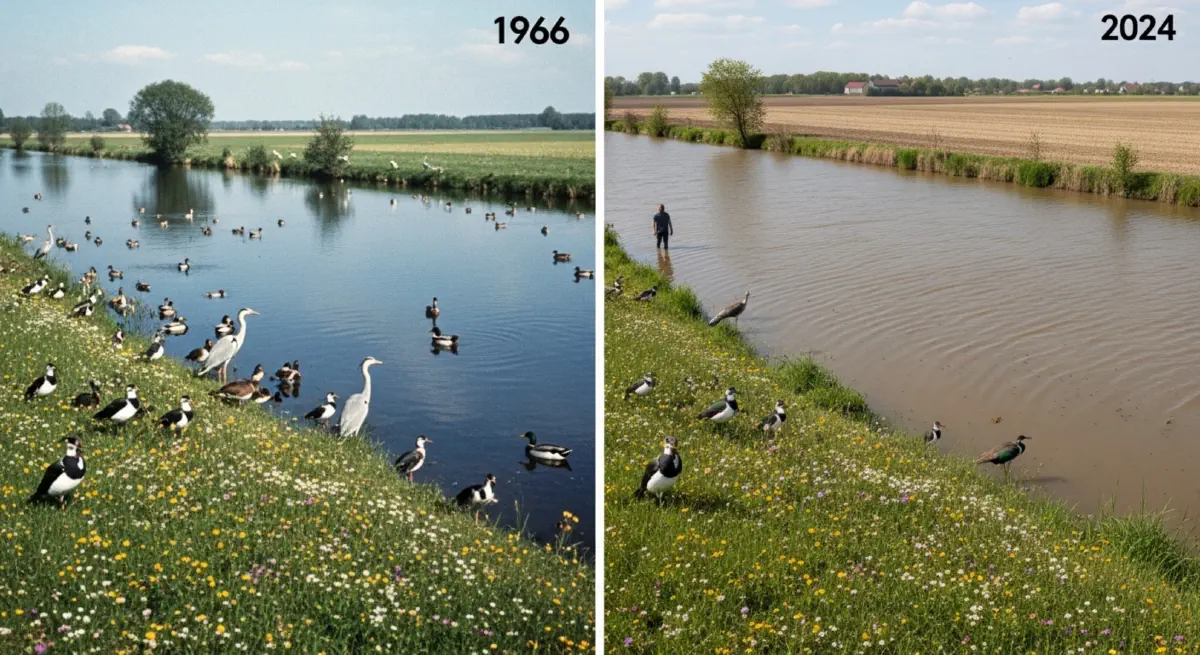
The Living Planet Index, compiled by the WWF and the Zoological Society of London, tracks global vertebrate population abundance across mammals, birds, reptiles, amphibians, and fish using trend data from more than 32,000 populations of 5,230 species. The 2022 edition recorded an average decline in monitored population sizes of 69% between 1970 and 2018. The freshwater decline is most severe: monitored freshwater species populations have declined by an average of 83%. The figure is not the number of species extinct — it is the average population size reduction across monitored species. Wild animal populations, not just endangered species, are experiencing drastic abundance declines across taxonomic groups.
What drives extinction#
The IPBES hierarchy of extinction drivers is instructive as a guide to where the Ecosystem Dependency Ratio's denominator is actually allocated, and whether it addresses the correct causes. The five primary drivers, in order of current global impact:
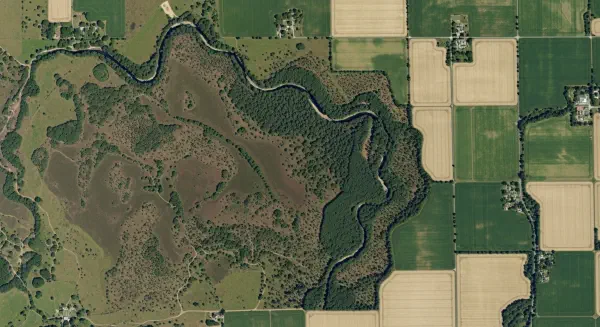
Land use change is the dominant driver, responsible for approximately 40% of vertebrate population decline. The conversion of tropical and subtropical forests to agriculture — globally continuing at approximately 10–13 million hectares per year — permanently destroys the habitat of species that have evolved over millions of years in specific ecological contexts. Species-area relationships predict that a 90% habitat reduction leads to approximately 50% species loss; the spatial fragmentation of remaining habitat is additive to the extinction pressure of absolute area loss, because isolation prevents the recolonisation that maintains the long-term viability of small populations.
Direct exploitation — fishing, hunting, and wildlife trade — is the second driver, responsible for approximately 35% of threatened species decline. The legal wild capture fisheries described in the second series of this sequence (The Ocean Economy) are the largest component; illegal wildlife trade, hunting for bushmeat, traditional medicine demand for threatened species, and the legal trophy hunting industry are smaller but significant contributors to vertebrate population decline, particularly for megafauna.
Climate change is the third driver, currently responsible for approximately 8% of assessed species threats, but projected to become the primary driver by 2050 under high-warming scenarios. The geographic range shifts required for species to track their temperature envelopes under climate warming are occurring approximately ten times faster than historical Holocene pace adaptations; species in specialised habitats (mountain tops, coral reefs, Arctic sea ice) face the prospect of range contraction to zero as their current habitats disappear.
Pollution and invasive species together account for the remaining drivers, with pollution particularly impacting freshwater systems and marine coastal zones, and invasive species causing disproportionate damage on island ecosystems and in freshwater bodies.
The insect indicator#
The biodiversity crisis is not limited to the charismatic megafauna that dominate wildlife conservation discourse. The broader collapse of invertebrate biomass — insects, arachnids, soil arthropods — represents a disintegration of the biological machinery that generates ecosystem services at the base of the food web and throughout productive ecosystems.
In 2017, Caspar Hallmann and colleagues published a study in PLoS ONE reporting the results of 63 nature reserves in Germany monitored between 1989 and 2016. Their finding: total flying insect biomass at monitored sites had declined by 76% over 27 years — not just threatened species, but the entire insect biomass including common and widespread species. The study used standardised malaise trap data and controlled for weather variation, habitat type, and year effects. The 76% figure held across seasons and site types.
The ecological implications of 76% insect biomass decline are not abstract. Approximately 75% of flowering plant species depend on insect pollination. Approximately 60% of bird species in temperate regions depend on insect prey during the critical breeding season, when protein demand for chick development is highest. Freshwater fish across Europe and North America feed predominantly on aquatic invertebrates; invertebrate biomass decline in river and lake systems translates directly to fish population decline. The reduction in insect biomass is not an isolated biological indicator — it is a measure of the functional throughput of ecosystems that generate the services the EDR captures.
The 76% figure from Germany, while the product of the most rigorous and long-running dataset available, is consistent with the directional findings from similar studies in the Netherlands, UK, and US. The evidence base is geographically concentrated in well-studied temperate regions and likely understates the global rate of invertebrate decline in tropical ecosystems where the species diversity is orders of magnitude greater and the monitoring data are correspondingly sparse.
The extinction debt#
Perhaps the most alarming concept in the biodiversity literature is "extinction debt" — the phenomenon by which species driven to small population sizes or severely fragmented habitats by habitat loss are committed to eventual extinction even after the habitat loss event has ceased. The species are still present, still countable in a species inventory, but moving toward a population size below minimum viable threshold in a deterministic trajectory from which recovery requires either intervention or the restoration of the habitat that was lost.
The concept, developed by Tilman and colleagues in a 1994 Nature paper using species-area relationships applied to fragmented prairie remnants, implies that the measured current extinction rate — itself historically unprecedented — is an understatement of the extinction rate that has been set in motion by the habitat loss of the last century. Species are going extinct at rates we can observe; many more have been committed to extinction without yet having died. This "committed extinction" load is the biological equivalent of the committed warming from CO₂ already in the atmosphere — change set in motion that will play out over decades regardless of decisions made today, whose scale depends significantly on what decisions are made today.
The Ecosystem Dependency Ratio therefore has a time structure that point-in-time calculations do not fully capture. The service flows currently being received by the economy depend on ecological communities that include species already committed to extinction. As those species are lost over the coming decades, the service flows will decline — with non-linear effects as keystone species and functional groups are removed from ecosystem structures that depend on them for stability. The EDR's numerator is not just declining because of land use conversion happening now. It is declining because of land use conversion that happened in the last century, whose extinction consequences are still propagating.
The next post examines the specific domain where biodiversity's economic dependency is most visible and least frequently acknowledged: the pharmaceutical value of wild species, and what the extinction rate means for the medicine cabinet.