The Challenge Recapitulated#
Over this series, we have examined Austria’s energy system in detail. Let us summarize the key findings:
Current state:
- Total primary energy: 1,381 PJ (~384 TWh)
- Fossil fuel share: 63%
- CO₂ emissions: ~70 Mt/year (energy-related)
- Current renewable electricity: ~70 TWh
Target state:
- Fossil fuel share: 0%
- CO₂ emissions: Near zero
- Required clean electricity: ~166 TWh
The gap between current and required clean electricity is approximately 96 TWh—more than doubling current renewable generation.
The Three Pillars of Decarbonization#
Success requires simultaneous action on three fronts:
Pillar 1: The Efficiency Mandate#
Reducing energy demand is the most cost-effective decarbonization strategy. The potential is enormous:
| Sector | Current (PJ) | Efficiency Target | Reduced (PJ) | Savings |
|---|---|---|---|---|
| Transport | 361 | BEVs (85% vs. 25%) | 106 | 71% |
| Buildings | 302 | Heat pumps + insulation | 85 | 72% |
| Industry | 317 | Electrification + efficiency | 220 | 31% |
| Other | 132 | Electrification | 95 | 28% |
| Total | 1,112 | — | 506 | 54% |
Through efficiency alone, Austria’s final energy demand could fall from 1,112 PJ to approximately 506 PJ—a reduction of over half.
This is not sacrifice; it is physics. Electric motors are more efficient than combustion engines. Heat pumps multiply energy. Modern insulation prevents waste. We can maintain the same services with far less energy.
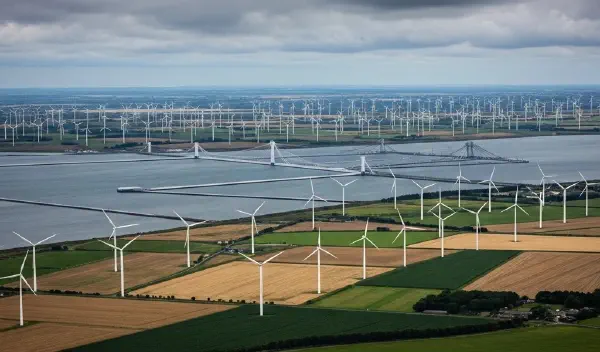
Pillar 2: Full RTP Exploitation#
Austria’s Reduced Technical Potential for renewable electricity:
| Source | RTP (TWh) | Current (TWh) | Gap (TWh) |
|---|---|---|---|
| Hydropower | 56 | 43 | 13 |
| Wind | 42 | 8 | 34 |
| Photovoltaics | 57 | 5 | 52 |
| Biomass/Other | 10 | 7 | 3 |
| Total | 165 | 63 | 102 |
Achieving full RTP requires:
- 48 GW of new PV capacity
- 15 GW of new wind capacity
- Modest hydro expansion and upgrades
At current deployment rates (~3 GW/year combined), this would take 20+ years. Acceleration is essential.
Pillar 3: The Hydrogen Economy#
Hydrogen plays several critical roles:
- Seasonal storage: Converting summer solar surplus to winter energy
- Industrial feedstock: Steel, chemicals, refining
- Heavy transport: Trucks, ships, possibly aviation
- Grid balancing: Large-scale flexible load (electrolyzers)
Estimated Austrian hydrogen demand in a decarbonized economy:
| Application | H₂ Demand (kt/year) | Electricity (TWh) |
|---|---|---|
| Industry | 200-300 | 10-15 |
| Heavy transport | 100-200 | 5-10 |
| Seasonal storage | 300-500 | 15-25 |
| Total | 600-1,000 | 30-50 |
This implies 20-30 GW of electrolyzer capacity and massive storage infrastructure.
The Investment Arithmetic#
Achieving full decarbonization by 2050 requires substantial investment:
| Category | Investment (€ billion) |
|---|---|
| Solar PV (52 GW) | 50-70 |
| Wind (18 GW) | 25-35 |
| Hydro upgrades | 5-8 |
| Grid infrastructure | 15-25 |
| Building renovation | 40-60 |
| Electrolyzers (25 GW) | 25-50 |
| Hydrogen storage | 10-20 |
| EV charging infrastructure | 5-10 |
| Total | 175-280 |
Call it €200 billion as a central estimate over 25-30 years.
This represents approximately €7-8 billion per year, or about 1.5-2% of Austrian GDP. For comparison:
- Austria currently spends €8-10 billion/year on energy imports
- Austrian defense spending is ~0.7% of GDP
- The COVID-19 response cost ~€40 billion
The investment is large but manageable—and unlike fossil fuel imports, it builds domestic assets and creates local employment.
The Employment Dividend#
A decarbonization program of this scale creates substantial employment:
| Sector | Jobs Created (Estimate) |
|---|---|
| PV installation | 30,000-50,000 |
| Wind construction/maintenance | 15,000-25,000 |
| Building renovation | 50,000-80,000 |
| Electrolyzer/hydrogen | 10,000-20,000 |
| Grid/infrastructure | 20,000-30,000 |
| Manufacturing | 20,000-40,000 |
| Total peak employment | 150,000-250,000 |
These are largely domestic jobs that cannot be outsourced—unlike much current energy expenditure.
The Policy Framework#
Technical feasibility is not enough. A plan that adds up requires:
Carbon Pricing#
A predictable, rising carbon price provides the economic signal for transition:
- Current EU ETS price: ~€80-100/tonne
- Required trajectory: €150-200/tonne by 2035
- Revenue recycling: Fund rebates and investment
Regulatory Standards#
Mandates accelerate adoption:
- Building codes requiring heat pumps in new construction
- Vehicle emission standards driving EV adoption
- Industrial efficiency requirements
- Grid connection obligations for renewables
Public Investment#
Some infrastructure requires state involvement:
- Transmission grid expansion
- Hydrogen backbone pipelines
- Research and development
- Training and education
International Cooperation#
Austria cannot optimize in isolation:
- European grid integration
- Hydrogen import corridors (North Africa, North Sea)
- Coordinated standards and regulations
- Shared R&D investments
The Timeline#
Phase 1: Foundation (2024-2030)#
- Deploy 15-20 GW of PV
- Deploy 8-10 GW of wind
- Begin building renovation acceleration
- Pilot hydrogen projects (1-2 GW electrolysis)
- EV market share: 50%+ of new sales
Result: 50% emission reduction
Phase 2: Scale-Up (2030-2040)#
- Complete PV deployment (52 GW)
- Complete wind deployment (18 GW)
- Mass hydrogen production (10-15 GW electrolysis)
- Building stock: 50% renovated
- EV market share: 90%+ of new sales
Result: 80% emission reduction
Phase 3: Completion (2040-2050)#
- Final renewable expansion
- Full hydrogen infrastructure
- Complete building renovation
- Phase out remaining fossil uses
- Achieve net-zero emissions
Result: Full decarbonization
What Could Go Wrong#
The plan faces risks:
- Political reversals: Changes in government commitment
- Technology disappointments: Cost reductions stall
- Public resistance: NIMBYism slowing deployment
- Global factors: Energy price shocks, supply chain disruptions
- Economic constraints: Recessions limiting investment capacity
Robust planning requires contingencies for each risk.
The Bottom Line#
Austria can fully decarbonize its economy by 2050 through:
- Aggressive efficiency improvements (~50% demand reduction)
- Full exploitation of renewable potential (~165 TWh/year)
- Strategic hydrogen deployment (~50 TWh/year)
- Investment of ~€200 billion over 25-30 years
The arithmetic adds up. The technologies exist. The resources are available. The economics are increasingly favorable.
What is required is collective will, sustained commitment, and intelligent policy.
We cannot negotiate with the laws of physics. But we can choose to work with them.
The transition to sustainable energy is not a sacrifice—it is an investment in a better, more prosperous, more secure future. The numbers show us the way. It is time to follow them.
This series was adapted from research conducted at European technical institutions and draws on data from the Austrian Energy Agency, Statistics Austria, and the International Energy Agency.
The author acknowledges the methodological foundation provided by Professor David J.C. MacKay’s seminal work “Sustainable Energy — without the hot air,” which demonstrated that energy policy debates benefit enormously from basic arithmetic.