The Integration Challenge#
Previous installments established that Austria could, in principle, generate 165 TWh of renewable electricity annually—enough for full decarbonization. But generating enough energy on average is not the same as having enough energy at every moment.
The fundamental challenge of high-renewable systems is temporal mismatch: supply and demand rarely align perfectly, and the gap must be bridged by storage, demand flexibility, or interconnections.
Understanding the Fluctuation Problem#
Demand Variability#
Austrian electricity demand varies by:
- Hour: ~6 GW at 3 AM to ~10 GW at 7 PM
- Day: Weekdays ~15% higher than weekends
- Season: Winter peak ~20% above summer
Total daily variation is roughly 4-5 GW around a mean of ~8 GW.
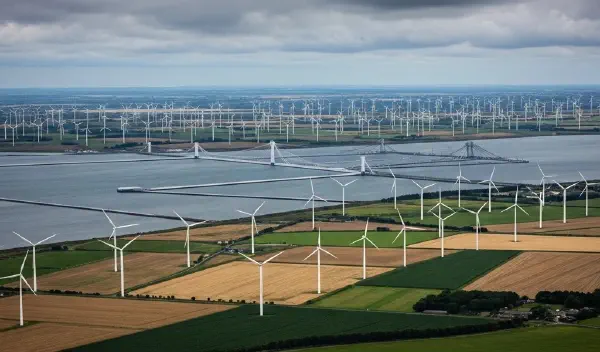
Supply Variability#
With 52 GW of PV and 18 GW of wind:
- PV daily range: 0 GW (night) to ~40 GW (noon, clear summer day)
- Wind daily range: 1-15 GW (weather-dependent)
- Combined: 1 GW to 55 GW possible range
At high penetration, there will be:
- Surplus periods: Generation exceeds demand by 20-40 GW
- Deficit periods: Generation falls below demand by 5-10 GW
Managing these swings requires multiple tools.
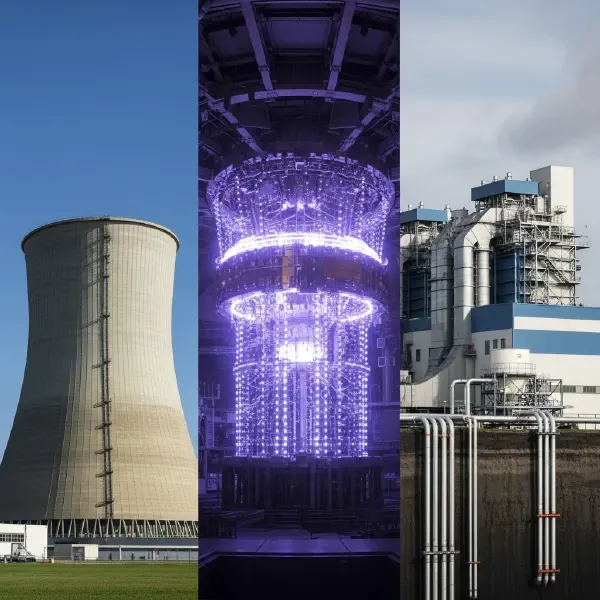
The Storage Portfolio#
Different storage technologies suit different timescales:
| Technology | Discharge Time | Efficiency | Cost (€/kWh) | Role |
|---|---|---|---|---|
| Batteries | 1-6 hours | 85-95% | 150-300 | Daily cycling |
| Pumped hydro | 6-12 hours | 75-85% | 50-100 | Daily/weekly |
| Compressed H₂ | Days-months | 30-40% | 10-50 | Seasonal |
| Liquid H₂ | Weeks-months | 25-35% | 20-80 | Seasonal/transport |
Austria’s existing pumped hydro (~3 GW, expanding to 5+ GW) handles most daily variability. But seasonal storage requires hydrogen.
Electrolysis at Scale#
If Austria converts seasonal surplus solar to hydrogen, what infrastructure is needed?
The Numbers#
Assume:
- Seasonal surplus: ~30 TWh (summer) to be stored for winter
- Electrolysis efficiency: 70%
- Required hydrogen: ~630,000 tonnes
- Electrolysis energy input: ~104 TWh (spread over 6 months)
Wait—104 TWh of input for 30 TWh of useful output? That’s the efficiency penalty of the hydrogen pathway. But summer solar surplus has near-zero marginal cost, so the comparison is between:
- Curtailing surplus solar (100% loss)
- Converting to hydrogen (60-70% loss but retaining 30-40%)
Infrastructure Requirements#
For 104 TWh of electrolysis over 180 days (summer):
- Average power: 24 GW of electrolyzer capacity
- Capital cost: ~€24-48 billion (at €1,000-2,000/kW)
- Water consumption: ~5.7 million m³ (~1% of Austrian annual precipitation)
This is enormous infrastructure—comparable to Austria’s entire current power sector.
Hydrogen Storage Engineering#
Compressed Gas (CGH₂)#
For vehicle applications, hydrogen is typically stored at 700 bar (70 MPa):
- Energy density: 5.6 MJ/L (vs. 32 MJ/L for gasoline)
- Tank weight penalty: ~20 kg tank per kg H₂
- Compression energy: 4-6 kWh/kg H₂
- Round-trip efficiency: ~90% (compression + storage)
Liquid Hydrogen (LH₂)#
For large-scale storage or long-distance transport:
- Liquefaction temperature: -252.9°C (20.3 K)
- Energy density: 8.5 MJ/L
- Liquefaction energy: 10-13 kWh/kg H₂ (~30% of LHV)
- Boil-off rate: 0.3-3% per day (inversely related to tank size)
A 10,000 m³ spherical tank experiences ~0.3%/day boil-off; a 100 L vehicle tank might see 3%/day.
Underground Storage#
For seasonal storage at national scale:
- Salt caverns: Best option where geology permits (limited in Austria)
- Depleted gas fields: Austria has potential in Vienna Basin
- Lined rock caverns: Expensive but flexible siting
- Hydrogen-natural gas blends: Up to 10-20% H₂ in existing pipelines
The H₂NG Bridge Strategy#
During the transition, blending hydrogen into the natural gas grid offers advantages:
- Uses existing infrastructure: Pipelines, storage, appliances
- Limited modifications: Up to 10-15% H₂ by volume requires minimal changes
- Gradual transition: Can increase blend ratio over time
- Reduced emissions: 10% H₂ blend reduces CO₂ by ~3%
However, this is a bridge, not a destination. Full decarbonization requires moving beyond natural gas entirely.
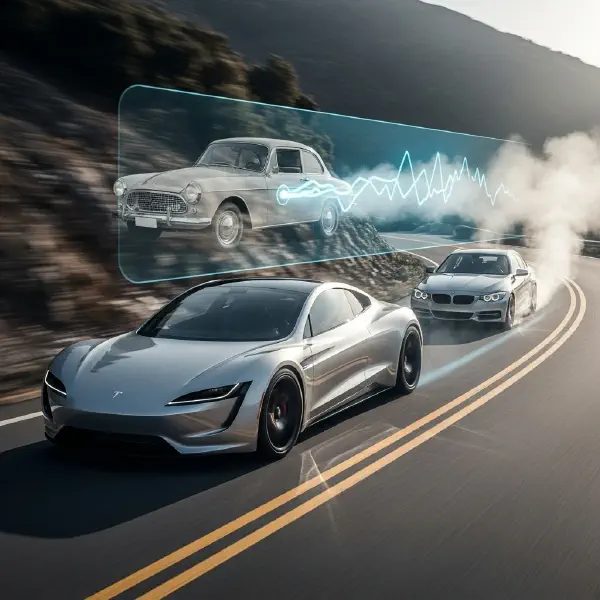
Electric Vehicles as Grid Assets#
Austria’s future EV fleet represents an enormous distributed storage resource:
The Numbers#
- Projected EV fleet (2040): ~5 million vehicles
- Average battery: 60 kWh
- Total capacity: 300 GWh
- Available for grid (20%): 60 GWh
For comparison, Austria’s current pumped hydro storage is about 40 GWh.
Vehicle-to-Grid (V2G)#
V2G technology allows EVs to:
- Charge during surplus periods (cheap electricity)
- Discharge during deficit periods (earning revenue)
- Provide frequency regulation services
Technical challenges include:
- Battery degradation from extra cycling
- Smart charging infrastructure
- Customer acceptance
- Grid integration standards
But even without V2G, smart charging can shift 50-70% of EV load to optimal times.
Peak Power Contribution#
If 1 million EVs each provide 7 kW of grid support:
- Total capacity: 7 GW
- Duration: 2-4 hours (at 20% battery utilization)
- Value: Comparable to several large power plants
The EV fleet could become one of Austria’s most important grid-balancing resources.
Grid Architecture for High Renewables#
Managing a 70%+ renewable grid requires:
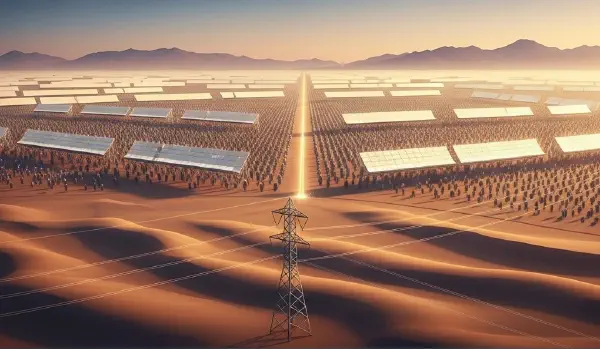
- Massive transmission upgrades: North-south links for solar, east-west for wind
- Distribution reinforcement: Millions of rooftop PV systems stress local grids
- Smart inverters: Reactive power support, frequency response
- Advanced forecasting: Predict wind/solar hours to days ahead
- Demand response: Industrial loads, heat pumps, EV charging
- Interconnections: Austria is already a hub for European power flows
The Control Room of the Future#
Grid operators today balance supply and demand using conventional power plants that can ramp up or down on command. In a renewable grid, they must orchestrate:
- Millions of distributed generators (rooftop PV)
- Millions of flexible loads (EVs, heat pumps, industrial processes)
- Thousands of storage systems (batteries, pumped hydro)
- Large-scale hydrogen production (electrolyzers)
- International power exchanges
This requires massive investments in:
- ICT infrastructure: Communications, computing, cybersecurity
- Market design: Real-time pricing, flexibility markets
- Regulatory frameworks: Standards, grid codes, tariff structures
The Practical Path#
The sequence of deployment matters:
- Now-2030: Deploy solar and wind rapidly; use existing flex (hydro, imports)
- 2030-2040: Build out battery and V2G; begin electrolyzer deployment
- 2040-2050: Scale hydrogen storage; achieve full decarbonization
Each phase builds on the previous, avoiding stranded assets while maintaining reliability.
In the final installment, we synthesize all elements into a coherent plan for Austrian decarbonization—one that adds up.
Grid data from Austrian Power Grid (APG), E-Control Austria