The Non-Renewable Options#
So far, this series has focused on renewable energy: hydro, wind, and solar. But a complete assessment of decarbonization pathways must also consider non-renewable low-carbon sources:
- Nuclear fission: Mature technology, controversial politics
- Nuclear fusion: The eternal promise, now perhaps closer
- Carbon capture and storage (CCS): Making fossil fuels “clean”
- Hydrogen from fossil sources: Currently the dominant production method
Nuclear Fission: The Numbers#
Nuclear fission currently provides about 5% of global primary energy and 10% of global electricity. In the EU, the share is higher: approximately 14% of total electricity.
Austria is notably nuclear-free—the only EU country to have rejected nuclear power by referendum (1978). But neighboring countries rely heavily on nuclear:
| Country | Nuclear Share (Electricity) |
|---|---|
| France | 70% |
| Slovakia | 53% |
| Hungary | 46% |
| Czech Republic | 37% |
| Germany | 0% (phase-out complete) |
| Austria | 0% (no plants built) |
The Physics of Fission#
Nuclear fission releases energy through the splitting of heavy atomic nuclei (typically uranium-235 or plutonium-239). The energy density is extraordinary:
- Uranium fission: 82 TJ/kg (82 million MJ/kg)
- Gasoline: 46 MJ/kg
- Ratio: ~1.8 million to 1
This enormous energy density means nuclear plants require tiny amounts of fuel and produce small volumes of waste (albeit highly radioactive waste).
Economics and Challenges#
New nuclear construction has become extremely expensive in Western countries:
| Project | Country | Cost (€/kW) | Construction Time |
|---|---|---|---|
| Flamanville 3 | France | ~€10,000 | 15+ years |
| Hinkley Point C | UK | ~€8,500 | 10+ years |
| Olkiluoto 3 | Finland | ~€7,000 | 18 years |
| Chinese AP1000s | China | ~€2,500 | 5-6 years |
The cost discrepancy between Western and Asian construction reflects:
- Loss of nuclear construction expertise
- Stricter safety regulations
- Complex project management
- Supply chain atrophy
For Austria, nuclear remains politically impossible. But imports of nuclear-generated electricity from neighbors are routine.
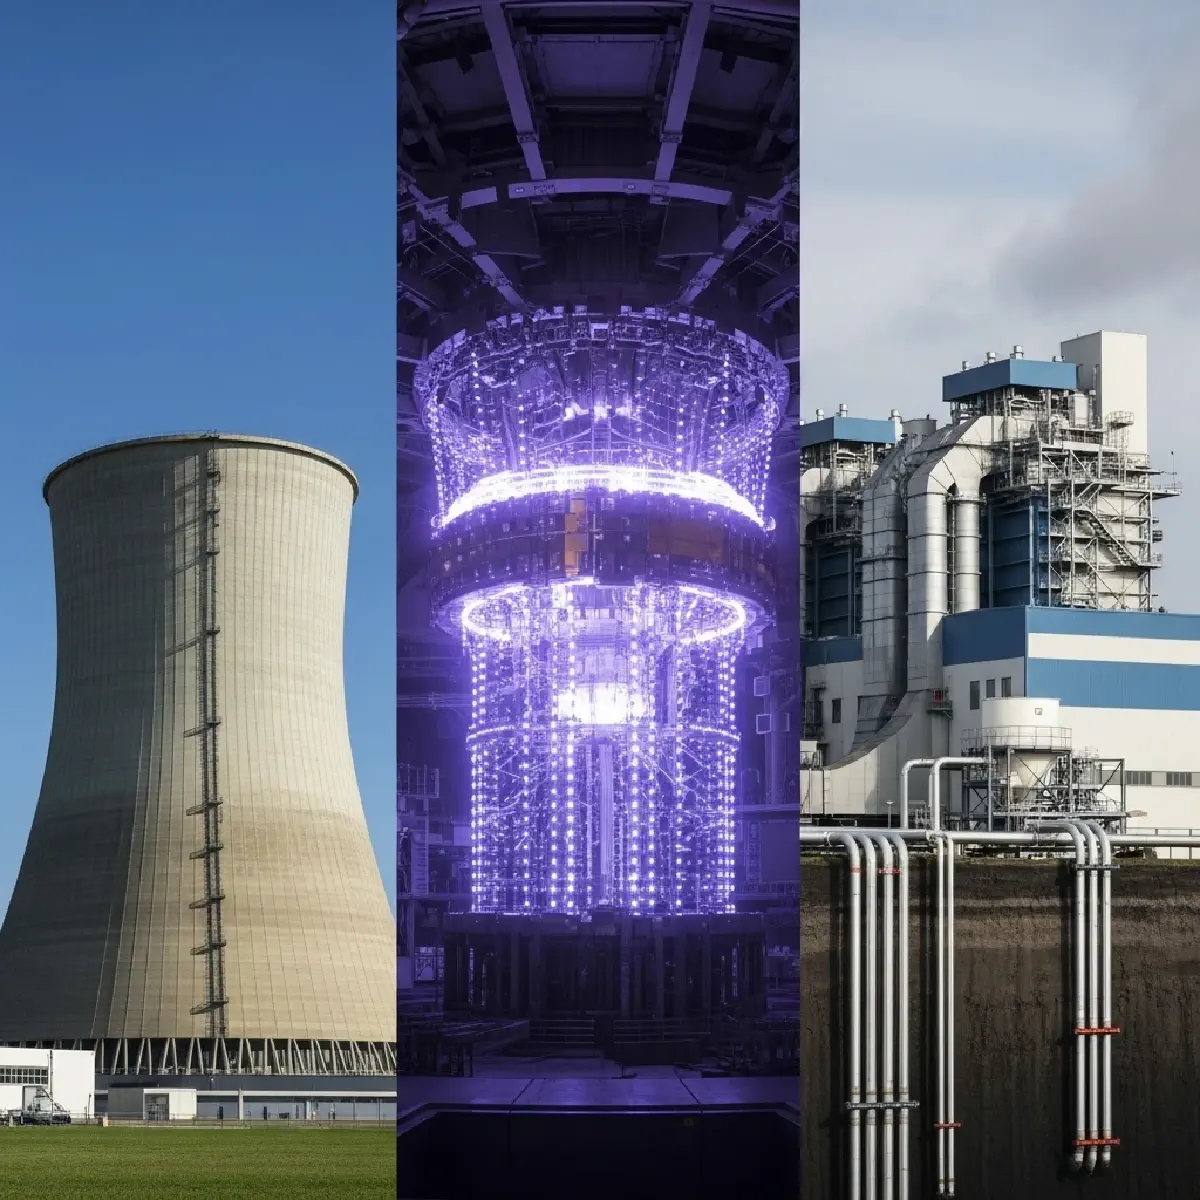
Nuclear Fusion: The Perpetual Future#
Nuclear fusion—the process that powers the sun—has been “30 years away” for the past 60 years. But recent progress suggests commercial fusion might finally be approaching.
The Physics of Fusion#
Fusion releases energy by combining light nuclei (typically deuterium and tritium) into heavier helium:
$$D + T \rightarrow He + n + 17.6 \text{ MeV}$$
The energy release per reaction is about 3.5 MeV/nucleon—roughly 4× greater than fission. Fuel is abundant (deuterium from seawater, tritium bred from lithium).
The Engineering Challenge#
Creating the conditions for fusion requires:
- Temperature: 150 million °C (10× hotter than the sun’s core)
- Pressure: High enough for nuclei to collide and fuse
- Confinement: Long enough for energy output to exceed input
The leading approach—magnetic confinement in a tokamak—has made steady progress:
| Machine | Year | Q (Energy Gain) |
|---|---|---|
| JET | 1997 | 0.67 |
| ITER (projected) | 2035 | 10 |
| DEMO (projected) | 2050+ | 25-50 |
ITER: The Test of Fusion’s Promise#
ITER, under construction in Cadarache, Provence, France, is the world’s largest fusion experiment. Key facts:
- Cost: €20+ billion (original estimate €5 billion)
- Timeline: First plasma 2025, full deuterium-tritium operation ~2035
- Partners: EU, US, Russia, China, Japan, South Korea, India
- Goal: Demonstrate Q ≥ 10 (net energy production)
If ITER succeeds, commercial fusion plants might be possible by 2050-2060. But fusion will not contribute to near-term decarbonization.
“Clean” Fossil Fuels#
Several technologies aim to continue using fossil fuels while reducing carbon emissions:
Carbon Capture and Storage (CCS)#
CCS captures CO₂ from power plant or industrial exhaust and stores it underground. The technology exists but is expensive:
- Capture cost: €40-100/tonne CO₂
- Transport and storage: €10-30/tonne CO₂
- Energy penalty: 25-40% (power plant efficiency reduction)
- Global deployment: ~40 Mt CO₂/year (vs. 36,000 Mt emitted)
CCS makes economic sense only with high carbon prices (>€80/tonne) or specific industrial applications.
Gasification#
Coal or biomass gasification produces a synthesis gas (syngas: H₂ + CO) that can be:
- Burned in efficient gas turbines
- Converted to liquid fuels (Fischer-Tropsch)
- Used as hydrogen source
Integrated Gasification Combined Cycle (IGCC) plants can achieve 45-50% efficiency with easier CO₂ capture. But costs remain high and few commercial plants operate.
CO₂ Neutrality vs. CO₂ Freedom#
It’s important to distinguish:
- CO₂-neutral: Net zero emissions (e.g., biomass, CCS, offsets)
- CO₂-free: Zero direct emissions (e.g., renewables, nuclear)
Hydrogen from natural gas with CCS is CO₂-neutral. Hydrogen from electrolysis with renewable electricity is CO₂-free. Both can contribute to decarbonization, but only CO₂-free sources are truly sustainable long-term.
Hydrogen from Fossil Sources#
Currently, about 96% of global hydrogen production comes from fossil fuels:
| Method | Share | CO₂ Intensity (kg CO₂/kg H₂) |
|---|---|---|
| Steam Methane Reforming (SMR) | 48% | 9-12 |
| Coal Gasification | 30% | 18-25 |
| Partial Oxidation | 18% | 7-10 |
| Electrolysis | 4% | 0-25 (grid-dependent) |
Color Coding of Hydrogen#
The industry has adopted a color scheme:
- Grey: From fossil fuels, no capture
- Blue: From fossil fuels with CCS
- Green: From electrolysis with renewable electricity
- Pink/Purple: From nuclear-powered electrolysis
- Turquoise: From methane pyrolysis (solid carbon byproduct)
Only green hydrogen is truly sustainable. Blue hydrogen can serve as a transition technology.
Hydrogen Purification#
Industrial hydrogen often requires purification. The standard method is Pressure Swing Adsorption (PSA):
- Uses molecular sieves to selectively adsorb impurities
- Achieves 99.99%+ purity
- Recovery rate: 70-90%
- Essential for fuel cell applications (which require high purity)
The Role of Non-Renewables#
For Austria specifically:
- Nuclear fission: Not politically viable domestically
- Nuclear fusion: Too far away to matter for 2030-2050 targets
- CCS: Limited domestic storage, not a priority
- Fossil-based hydrogen: Acceptable as bridge, not endpoint
The path to decarbonization runs through renewables, efficiency, and electrification. Non-renewable options may play supporting roles but cannot be the foundation of a sustainable energy system.
In the next installment, we examine the practical challenges of managing a grid powered predominantly by variable renewables—and the role of electric vehicles and hydrogen in stabilizing it.
Data from ITER Organization, IEA, World Nuclear Association