1. Introduction#
This report details the formulation of a quantitative model designed to simulate the structural degradation of human organizations. While organizational behavior is traditionally treated as a qualitative sociological discipline, this model translates well-documented behavioral axioms—such as Goodhart's Law, the Peter Principle, and Conway's Law—into a system of continuous mathematical functions. By mapping these principles using differential relationships, power laws, and limit functions, we can visualize and predict the point at which an organization’s internal friction eclipses its productive output.
2. Rationale: Why Develop This Model?#
The primary motivation for developing this model is to bridge the gap between abstract organizational theory and systemic engineering. Large-scale human systems frequently fail not due to a lack of capital or market fit, but due to internal, structural entropy.
We developed this mathematical framework to:
- Quantify the Unquantifiable: Transition concepts like "bureaucratic bloat" and "metric gaming" from anecdotal complaints into measurable, predictable vectors.
- Identify Systemic Tipping Points: Provide executives and system architects with visual thresholds (e.g., the point where administrative cost outpaces product integration) to diagnose institutional rot before it becomes terminal.
- Design Resilient Architectures: By understanding the exact mathematical curves of decay, organizations can engineer counter-measures—such as dual-track promotion systems or dynamic, un-gameable metrics—to mitigate these inevitable human friction costs.
3. Core Assumptions#
To translate complex human behaviors into deterministic equations, the model relies on several foundational assumptions:
- Rational Optimization (Goodhart’s Assumption): Employees act as rational, energy-conserving agents. If incentivized by a single proxy metric, they will optimize exclusively for that metric, regardless of the degradation of the broader system.
- Non-Linear Productivity (Pareto Assumption): Human output in complex tasks is not normally distributed; it follows a power-law distribution where a small minority generates the vast majority of value.
- Competence Ceiling (Peter Assumption): Organizations promote based on current-role performance, not future-role capability. Once promoted, an individual's direct productive output drops to a baseline "incompetence" level.
- Temporal and Cognitive Bias (Parkinson/Hofstadter Assumption): Agents will artificially expand work to consume all allocated time buffers. Furthermore, human ability to estimate time decays exponentially as task complexity increases.
- Structural Determinism (Conway/Shirky Assumption): The communication friction between internal teams dictates the fragmentation of the final product, and administrative bodies actively resist solving the problems that justify their budgets.
4. Basis for Values and Parameters#
The numerical constants used in the model are derived from empirical studies and established mathematical translations of sociological laws.
- Pareto Distribution ($\gamma \approx 0.86$): To model the 80/20 rule, the exponent $0.86$ is used in the power law $y(x) = c x^{-\gamma}$. This mathematically ensures that integrating the top $20\%$ of the population yields approximately $80\%$ of the total output (Newman, 2005).
- Promotion Cutoff ($20\%$): The model simulates the removal of the top 20% of producers into management. This aligns with empirical findings that firms heavily prioritize top sales/production performers for management, often resulting in negative managerial value added (Benson, Li, & Shue, 2019).
- Goodhart's Decay Coefficient ($\beta = 0.35$): Used in the function $V(p) = \alpha p e^{-\beta p^2}$ to represent the friction of "gaming." While heuristic, the use of exponential decay to model the divergence of proxy from true value is standard in systemic risk modeling (Manheim & Garrabrant, 2018).
- Hofstadter’s Drift ($\delta = 0.2$): Represents the cognitive optimism bias. The exponential failure of project estimation in highly complex systems relies on Kahneman and Tversky's foundational work on the planning fallacy (Kahneman & Tversky, 1979; Hofstadter, 1979).
- Bureaucratic Growth and Conway Friction ($\kappa = 0.5$, $\gamma_b = 0.3$): These constants represent the speed at which administrative mass solidifies and product coherence degrades. They serve as illustrative baselines representing the inevitable entropy described by Conway and Shirky (Conway, 1968; Shirky, 2010).
5. Output Figure Analysis#
For an interactive version of the figures, please visit the 9 Laws of Organizational Decay Interactive Dashboard.
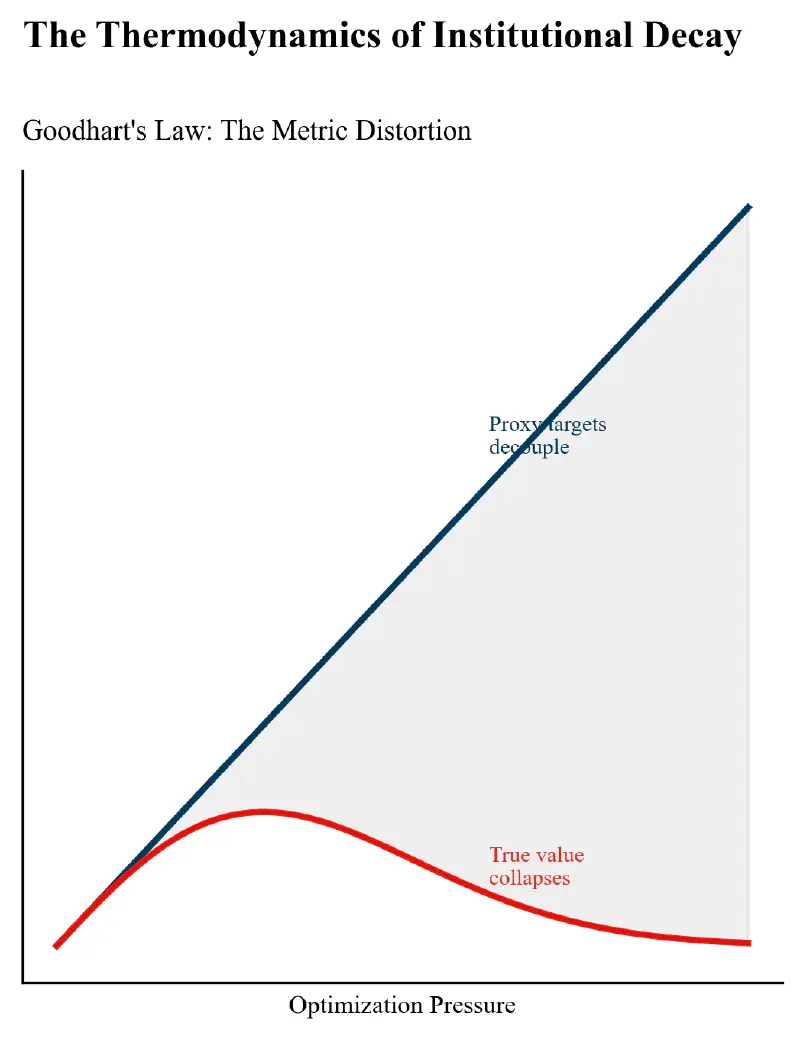
Goodhart's Law and Metric Distortion#
This panel visualizes the catastrophic decoupling of perceived performance from actual reality. The blue line represents the measured proxy metric (e.g., lines of code written, customer calls handled), which scales linearly as optimization pressure is applied. However, the red curve illustrates the true underlying value to the system. Initially, the proxy and true value correlate. But as pressure increases, agents begin to "game" the system—sacrificing quality for volume. The mathematical consequence is an exponential decay of true value, visually highlighting the gray "deadweight loss" zone where management believes productivity is soaring while the actual system is collapsing.
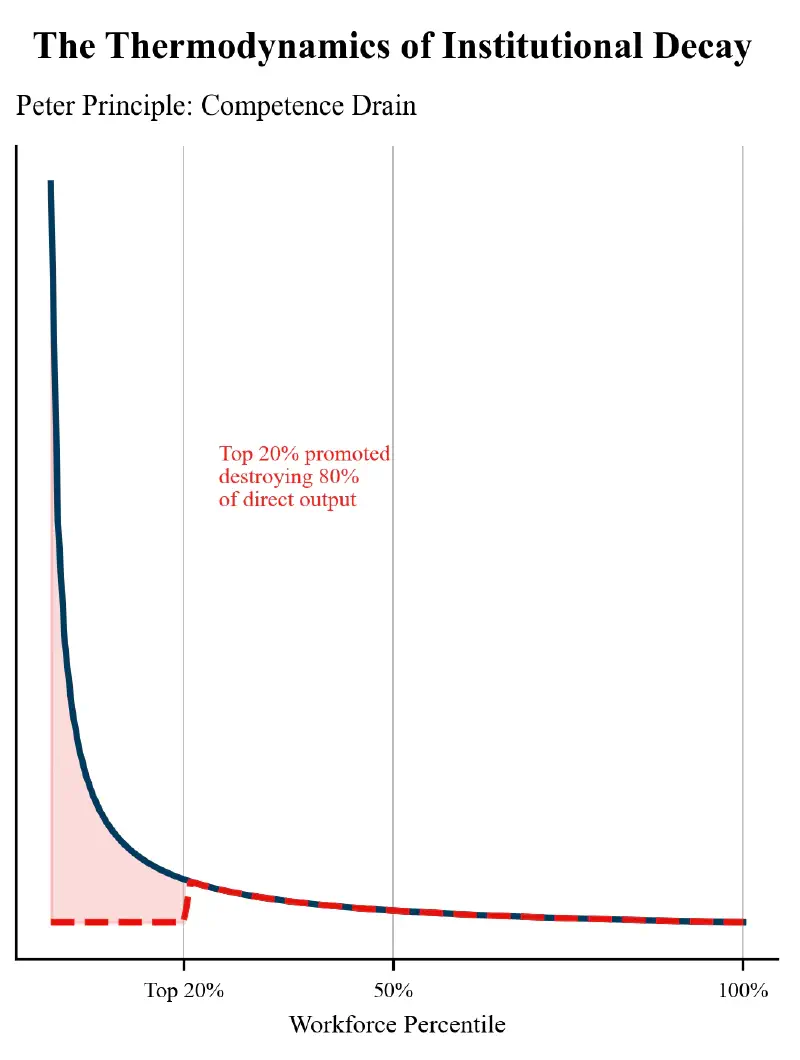
The Pareto-Peter Collapse#
This panel starkly illustrates the mathematical destruction of talent. The blue curve maps the natural Pareto distribution of human output, where a massive spike in productivity is concentrated in the top 20% of the workforce. The dashed red line reveals the system post-promotion, dictated by the Peter Principle. By promoting this vital top 20% out of direct production and into management roles (where they lack native competence), their output crashes to a flat, mediocre baseline. The shaded red area quantifies the immense volume of raw productivity permanently destroyed by traditional hierarchical promotion structures.

Parkinson & Hofstadter's Temporal Bloat#
This figure maps the paradox of project scheduling. The dotted gray line represents the theoretical minimum time required to complete a task based purely on complexity. The blue line represents Parkinson's Law—the time management actually allocates, complete with safety buffers. For simple tasks, the red line (actual execution time) hugs the blue line, meaning work artificially expands simply to fill the allocated buffer. However, as complexity scales past a critical threshold, Hofstadter's Law triggers an exponential explosion in time requirements. The chart visualizes two distinct zones of inefficiency: time wasted intentionally on simple tasks (Parkinson's trap) and time lost to catastrophic estimation failure on complex ones (Hofstadter's trap).
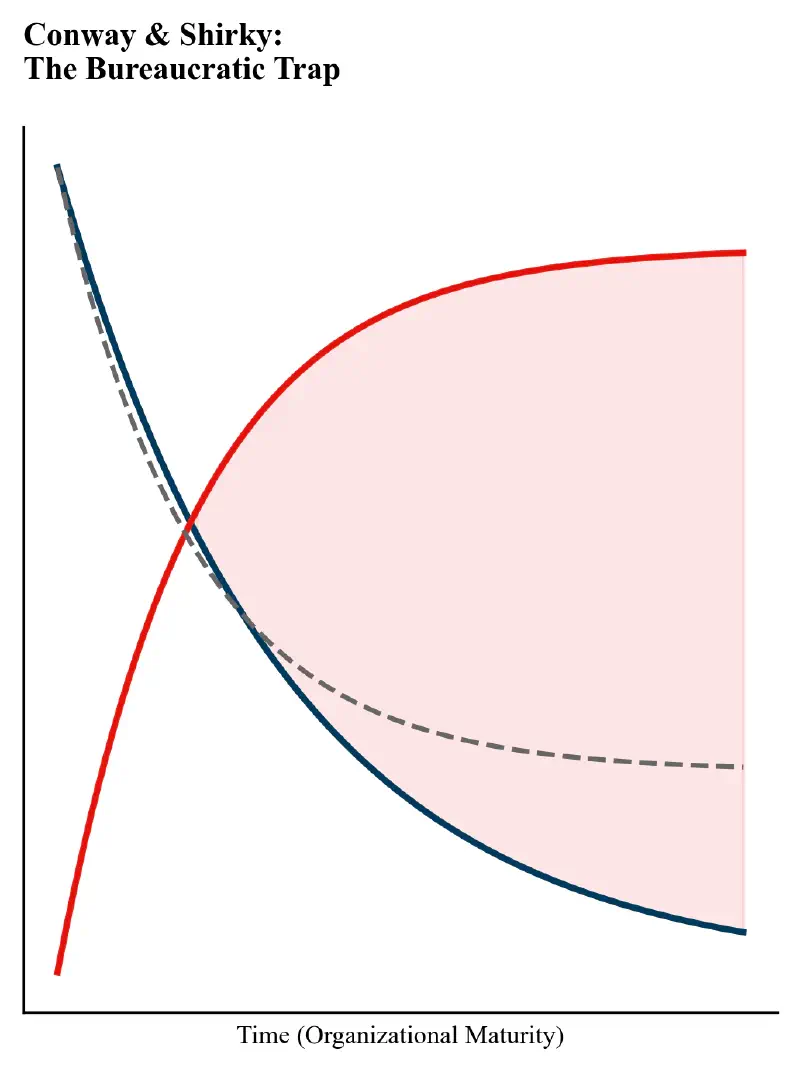
Conway & Shirky's Bureaucratic Trap#
The final figure represents the ultimate crystallization of institutional decay. The declining blue curve tracks Conway's Law, showing how the integration and value of a product decay exponentially as internal communication silos harden over time. Conversely, the rising red curve maps the Shirky Principle: the administrative budget and mass required to "manage" an internal problem, which rapidly scales to its maximum cap. The critical insight is the intersection point. Once the red line crosses above the blue line, the organization enters a permanent state of deadweight loss. At this stage, the institution spends more resources maintaining its own bureaucracy than it generates in integrated product value, actively preserving the baseline problem (the dotted gray line) to justify its continued existence.