The Eighth Entry in a Table That Got It Wrong#
On January 5, 2025, the Lancet Gaza Health Investigator Group published a carefully constructed estimate. Drawing on Gaza's Ministry of Health records, cross-verified against population survey data and documented structural destruction, they concluded that 75,200 people had been violently killed in Gaza between October 7, 2023 and the study's cutoff date. The number represented the counting methodology best supported by available evidence. It was not a protest figure. It was peer-reviewed epidemiology.
That same month, if one tabulated UCDP's coded battle deaths for the calendar year 2024, Gaza appeared eighth in the global ranking of deadliest conflict-years. Eighth — behind Ethiopia's Tigray aftermath, behind Ukraine, behind Sudan, behind the DRC. The UCDP figure for Gaza in 2024, approximately 21,465, was lower than the Lancet estimate for the same period, partly because of different coding scopes. But even using the UCDP's own annual figure, the placement made a kind of sense: absolute death counts in a world where Ethiopia and Ukraine had each produced well over 50,000 battle deaths in recent years were not unusual.
The problem is not that the UCDP got the number wrong. The problem is that placing Gaza eighth — 21,465 deaths — beside Ukraine's much larger absolute counts, while not noting that Gaza's population is roughly 2.3 million people contained within 365 square kilometers, makes two categorically different experiences appear comparable. They are not. Counting the dead without counting the living produces a fundamental distortion of what violence means.
A Metric Built to Correct the Distortion#
Raw death counts are necessary but insufficient for understanding the severity of war. The Human Cost Index (HCI) corrects for the most systematic source of distortion in comparative conflict analysis: the failure to normalize casualties against the size of the population bearing them. HCI is defined as total conflict casualties divided by population, multiplied by 10,000 — expressing violence as deaths per 10,000 people. The multiplication by 10,000 converts the ratio to a scale that is legible without scientific notation and that enables intuitive comparison across conflicts of vastly different sizes.
This is not a novel intellectual move. Epidemiology has normalized outcomes by population for over a century. The concept of a mortality rate — deaths per thousand, deaths per hundred thousand — is the foundation of public health analysis. The application of the same logic to conflict deaths is long overdue, and its absence from the dominant frameworks of conflict data — including the UCDP — is a gap that Gleditsch and colleagues themselves identified in 2002. They called for better human cost accounting. HCI is that accounting, applied to the present.
What the Numbers Actually Show#
The Formula and Its Results#
The Human Cost Index computes as: (total conflict deaths ÷ population) × 10,000. Applied to the major conflicts of the modern era, the results are stark.
Rwanda in 1994 is the benchmark case. An estimated 800,000 people were killed in 100 days in a country of approximately 7 million. Its HCI is 1,143 deaths per 10,000 people — by far the highest recorded for any modern conflict. Rwanda is the extremity that calibrates the scale.
Gaza, from October 7, 2023 through the ceasefire and into 2026, has accumulated an estimated 75,200 violent deaths from the Lancet's best estimate, in a population of approximately 2.3 million. Its HCI is 327 deaths per 10,000 people. That figure places Gaza second in the modern record, behind only Rwanda's genocide.
Syria's 13-year civil war (2011–2024), with approximately 500,000 deaths in a pre-war population of 17 million, produced an HCI of approximately 294. Afghanistan's 20-year conflict (2001–2021) killed an estimated 240,000 people in a population of 38 million: an HCI of 63. Ukraine's conflict from 2022 through 2024, with approximately 200,000 battle deaths in a population of 43 million, produced an HCI of 47. Ethiopia's Tigray war (2020–2022), with approximately 300,000 deaths in a population of 120 million, produced an HCI of 25.
The 2026 Iran-Israel-US war, 31 days old as of this writing, has already produced measurable divergence. Lebanon's 1,238 dead in a population of 5.5 million yields an HCI of 2.25. Iran's 1,937 dead in a population of 90 million yields an HCI of 0.22. Same conflict, same 31 days, same period of active warfare — and a ratio of more than 10:1 in effective human cost, reflecting the profound difference between what those deaths mean to the populations absorbing them.
Why Power Asymmetry Makes Raw Counts Meaningless#
The distortion that HCI corrects for is most severe in asymmetric conflicts — those in which one party possesses decisive military superiority and uses it against a population that cannot disperse, evacuate, or mount effective defense. Gaza is the paradigm case.
Israel entered the Gaza conflict with the full military capabilities of a technologically advanced state: F-35 fighter jets, precision-guided munitions, naval blockade capacity, and an intelligence infrastructure capable of targeting individual buildings. Gaza had none of these. Its population density, approximately 7,569 people per square kilometer by 2023 estimates, is among the highest in the world. The geography — a narrow coastal strip 41 kilometers long and between 6 and 12 kilometers wide — meant that no location was far from a military target, and no safe zone could be maintained at scale.
The UCDP counts "battle-related deaths" — deaths resulting from the use of weapons in organized armed confrontation between parties. In asymmetric urban warfare, this definition encounters its operational limit: the distinction between a combatant killed in a battle and a civilian killed in a strike on a building that contained a combatant is often impossible to establish from available evidence, and the UCDP dataset itself acknowledges the uncertainty by publishing "best," "low," and "high" estimates. What is not uncertain is the demographic reality: in Gaza, by January 2026, the Ministry of Health had documented 72,063 dead, of whom more than 44% were children under the age of 18.
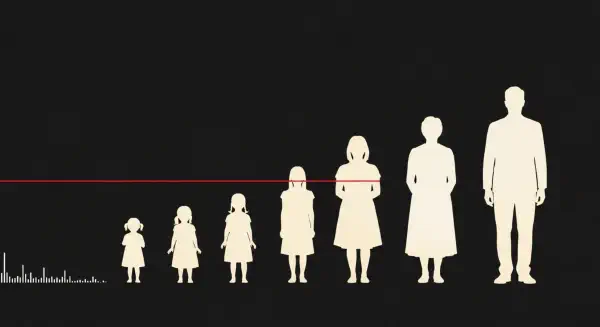
This demographic profile matters for HCI in a way it cannot matter for raw counts. Gaza's pre-war population included approximately 43% under the age of 15 — a function of its high birth rate and the young average age of its population. When that population absorbs 3.27% casualties in 2.5 years, the impact on the cohort that would constitute Gaza's next generation is proportionally catastrophic. Raw death counts do not represent this. HCI does not fully represent it either. But HCI is significantly closer to the truth.
A Reordered Table of Modern Atrocity#
When the same major conflicts are ranked by HCI rather than absolute deaths, the table that emerges is morally and analytically different from the one that appears in most conflict databases. Rwanda is first: 1,143 per 10,000. Gaza is second: 327. Syria is third: 294. Afghanistan is fourth: 63. Ukraine is fifth: 47. Ethiopia is sixth: 25. Lebanon 2026 is seventh: 2.25. Iran 2026 is eighth: 0.22.
Afghanistan, which by raw count produced 240,000 deaths over 20 years — a figure that frequently appears as a headline measure of the war's toll — falls to fourth. Ukraine, which has dominated global conflict reporting since February 2022 and which produced more single-year battle deaths than almost any other recent conflict, falls to fifth. Gaza, which ranks eighth in the UCDP's 2024 annual table, rises to second across the full period of the conflict.
This reordering is not simply an exercise in statistical reorganization. It reflects a substantive judgment: that the same number of deaths means categorically different things to a population of 2.3 million than to a population of 43 million, in the same way that losing 327 soldiers in a police precinct of 10,000 people means something different to that institution than losing 327 soldiers from an army of 10 million.
Completing the Work of the Uppsala Scholars#
The 2002 UCDP paper's "Future Improvements" section included a precise and prescient passage: "In order to study the severity of war, and in particular its human cost, there is a need for more accurate casualty statistics." The authors noted that the Kosovo conflict of 1999, in which dozens of NATO countries participated without suffering significant military casualties, illustrated the weakness of any measure that treated all active parties as equally affected. High participant counts made Kosovo appear large; actual human cost made it small.
The logic of HCI extends this critique. A conflict in which a powerful military apparatus applies sustained force against a small, densely populated territory is not comparable, on any meaningful dimension of human experience, to a conflict of similar absolute death toll between armies of comparable size in a country of 50 million people. The UCDP measures conflicts. HCI measures what conflicts do to the communities they occur within.
The gap between Israel's HCI contribution from the same 2026 war — near zero, because Israeli civilian casualties have been small relative to a population of nine million — and Gaza's HCI of 327 reflects not a judgment about the conflict's causes or moral weight. It reflects the physical reality of who has borne the cost. That physical reality is what international humanitarian law is designed to limit. A Geneva Convention that protects individuals equally is not a Geneva Convention that produces equal outcomes when applied to a population of 90 million on one side and 2.3 million on the other.
HCI makes that asymmetry legible in a single, reproducible number. It does not answer the question of what to do about it. But it does prevent the obfuscation that raw counts make possible — the conflation of different scales of suffering into a single column of a spreadsheet. The next post takes HCI one step further: dividing it by duration to produce the Casualty Rate, the metric that measures not how much has been destroyed, but how fast.