The Calculation That Took a Century to Make#
When Lance Davis and Robert Huttenback sent their manuscript to Cambridge University Press in the early 1980s, they had spent over a decade constructing a database that no one had previously attempted to build. Working from corporate records, parliamentary returns, Stock Exchange yearbooks, and the financial press of the late Victorian and Edwardian periods, they had assembled returns data for approximately 482 companies operating in the British Empire between 1860 and 1912, and compared those returns to a control set of roughly 316 domestic companies operating over the same period. The question they were asking was empirically simple: did companies operating in the empire produce better or worse returns for their investors than companies operating at home?
Their answer, published in Mammon and the Pursuit of Empire in 1986, was unequivocal. Imperial companies, on average, produced lower rates of return than domestic companies. The difference was not enormous, but it was consistent across time periods and across the empire’s geographic zones. For the dependent empire — Crown India and British Africa — the underperformance was clearest. The companies operating in the territories most completely under British political control, in the territories whose populations had no legal means to contest the terms of investment, produced returns that compared poorly with a factory in Birmingham or a railway in Lancashire.
This finding has not been seriously contested in the economic history literature. But its implications — which Davis and Huttenback drew out with scrupulous care — have not entered the public discussion of empire in any meaningful way. Those implications are the subject of this post.
Where British Capital Actually Went#
The Aggregate Numbers#
Davis and Huttenback’s analysis of capital flows used the measure of “capital called up” — the actual money raised through company flotations and bond issues, as recorded in contemporary financial sources. Their findings for the period 1865–1914 can be summarized in three numbers. Domestic investment absorbed roughly 40–46% of British capital in each decade across the period. The empire as a whole attracted roughly 20–28%, rising across the period. The remaining roughly 30–38% went to non-empire foreign investment — railways in Argentina, bonds in the United States, mining ventures in Russia.
The figure that matters most for this analysis is the one that contradicts the standard narrative most directly: the dependent empire — Crown India, British Africa, the territories where British political control was most complete and colonial extraction most systematically organized — attracted approximately 3% of British private capital flows across the full period. Not 3% of imperial capital; 3% of all British private investment. Slightly more than one pound in thirty of British private investment over fifty years went to the territories that populated the most vivid imagery of the imperial project: the Indian subcontinent, East and West Africa, the colonial peoples whose labor and land were the subject of the parliamentary debates documented in the previous posts.
The bulk of imperial capital went to the settler colonies — Canada, Australia, New Zealand, South Africa — where British emigrants and their descendants had created familiar institutional environments, and where investment in railways, mines, and land was recognizably similar in structure to domestic investment. These territories were not free of exploitation; their Indigenous populations bore costs that no nineteenth-century balance sheet attempted to measure. But from the perspective of the British investor, settler-colony investment resembled domestic investment in risk profile and return structure, which is precisely why it attracted capital.
Why Would Low Returns Not Deter Investment?#
The obvious question that Davis and Huttenback’s finding generates is: if imperial investment underperformed domestic investment, why did British capital flow to the empire at all? Part of the answer is that investors did not have precise comparative return data available to them in real time — the calculation Davis and Huttenback required ten years to construct was not available to a Victorian stockbroker. Part of the answer is that imperial investment carried prestige and political associations that influenced allocation decisions independently of financial calculus.
But the most important part of the answer, and the one Davis and Huttenback develop most carefully, concerns the distribution of risk and return within the aggregate. The average imperial return was lower than the domestic average. But the distribution was not symmetric. A small number of investors — those with privileged access to insider information, government connections, or early-mover positions in specific sectors — achieved exceptional returns. A much larger number of imperial investors achieved mediocre or poor returns. The aggregate concealed a distribution in which connected insiders profited while the broader investing public generated the capital that funded their position.
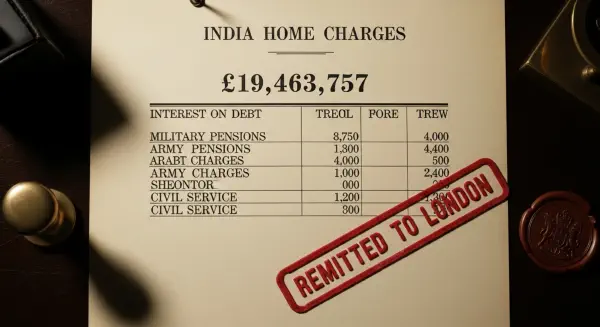
This pattern — connected insiders profiting from a system whose costs are distributed broadly — is not specific to Victorian imperialism. It is the structural signature of an extractive system: the insider profits because the system insulates their position from competition, and the system is insulated from competition because the political connections that created it are also the political connections that maintain it. The Home Charges, the India Office structure, the military pension system reviewed in the previous post — all of these were administered by men whose careers and social networks overlapped extensively with the investor class that held India Office stock and imperial corporate securities.
The Taxpayer Who Funded the Investor’s Returns#
The Defense Subsidy#
Davis and Huttenback’s most important finding for a distributional analysis is their treatment of what they call the “defense subsidy.” The Royal Navy, in the Victorian period, was the essential infrastructure of British trade and investment globally. It maintained the sea lanes along which British exports traveled to India and British goods reached colonial markets. It enforced commercial treaties. It suppressed piracy. It demonstrated British state power in a way that reduced the political risk premium that private investors would otherwise have had to price into their returns.
The Navy was not free. In the 1870s and 1880s, the naval budget consumed approximately £10–12 million per year. In the 1890s and 1900s, as the naval construction race with Germany accelerated, it rose sharply. This cost was borne by British taxpayers — all of them, through the consolidated general revenue. But the benefit of the reduced political risk premium in imperial investment flowed primarily to those who held imperial securities. The Birmingham factory worker who paid income tax on his wages was, in this sense, subsidizing the return on the Indian railway bond held by the Manchester merchant.
Davis and Huttenback attempted to quantify this subsidy — the portion of British defense expenditure that could reasonably be attributed to the protection of imperial investment. Their calculation, necessarily approximate, suggested that when this defense subsidy was allocated against imperial investment returns, the “excess return” that imperial investment appeared to generate over risk-free alternatives largely evaporated. The empire, including defense costs, produced returns roughly comparable to domestic investment — but only if you assigned defense costs to the investor class rather than the taxpayer class.
The system was specifically organized to prevent that assignment from being made. Defense was funded through general taxation. Investment returns were private income. The two columns were kept in separate ledgers, never brought together for a consolidated accounting of who was paying what for whom.
The Compensation That Made the System Explicit#
There is one historical moment at which the distributional reality of the British imperial system was not hidden in accounting structure but made explicitly visible through legislation: the passage of the Slavery Abolition Act in 1833. The Act abolished slavery throughout the British Empire. It compensated slave-owners £20 million — the equivalent today of approximately £17–20 billion — for the loss of their “property.” It provided nothing to the formerly enslaved.
The £20 million was borrowed by the British government. The debt was serviced by British taxpayers. It was not fully repaid until 2015. The beneficiaries were 46,000 slave-owners, concentrated in the West Indies, the Cape Colony, and the British possessions in Mauritius and Ceylon. The claimants included members of Parliament, Church of England bishops, and prominent families whose descendants remain identifiable in British public life today. The archive of the Slave Compensation Commission — digitized by University College London in the Legacies of British Slave-ownership project — makes the distributional reality of the 1833 Act unusually legible.
This is not an anomaly in the history of British imperial economics. It is the system operating transparently. Costs were socialized through general taxation; gains were privatized to a specific propertied class; and when the system changed, the adjustment mechanism was designed to compensate the property-holders, not those whose appropriated labor had funded the property’s value.
The Settler Colony Model and Its Exceptions#
Where Capital Actually Produced Something#
The settler colonies present a genuinely complicated picture within the Davis and Huttenback framework. Canadian and Australian railways were financed by British capital, built by migrant labor, and produced returns that — while not dramatically superior to domestic alternatives — were reasonably competitive. The institutional similarity between the settler colonies and Britain itself — common law traditions, reliable contract enforcement, political stability, a broadly similar labor market structure — meant that British capital operating in these territories could rely on the same frameworks that made domestic investment functional.
The contrast with the dependent empire is instructive. In India, British capital operated in a political context where the Indian state had no capacity to set the terms of investment, workers had no legal protection equivalent to British labor law, and the exchange rate between sterling and the rupee was managed in ways that benefited British creditors at the expense of Indian borrowers. These differences in institutional context were not incidental to investment returns — they were the mechanism by which returns were structured. The dependent empire did not produce lower returns because it was inherently less productive. It produced lower average returns because the specific extraction mechanisms available to connected insiders did not improve average returns — they redistributed them from the many to the few.
Davis and Huttenback’s finding that the dependent empire attracted only ~3% of private capital flows, while generating the most vivid political rhetoric about imperial greatness and civilizational mission, is the sharpest single point in their analysis. The rhetoric was about India and Africa. The capital went to Canada and Australia. The tax-funded defense infrastructure protected the entire system. The returns concentrated in a small connected class while the costs — in military obligation, in fiscal transfer, in the foregone domestic investment discussed in the next post — were distributed across everyone else.
The Arithmetic of the Subsidy#
A Rough Calculation#
Davis and Huttenback did not publish their defense-subsidy calculation in a form easily reduced to a single number, but the structure of their argument permits a rough approximation. If the British naval and military budget attributable to imperial protection averaged £8–10 million per year across the 1865–1914 period, and this cost was borne by British taxpayers numbering approximately 10–15 million working adults, the per-capita cost of the imperial defense subsidy was roughly £0.60–£1.00 per year. In today’s terms, this is approximately £80–130 per taxpaying adult per year.
Against this, the return premium that imperial investment generated over domestic alternatives was, in Davis and Huttenback’s analysis, close to zero once defense costs were correctly allocated. The approximately 1–3% of the British population who held significant quantities of imperial securities received a guarantee on their returns, funded by the taxation of the 97–99% who held no such securities. The working adult in a Midlands factory, paying income tax and excise duties, was funding a guarantee on the bond portfolio of the retired India Office official whose pension was simultaneously funded by the Indian agricultural taxpayer.
This is what Hobson meant by “bad business for the nation, good business for certain classes.” Not a rhetorical flourish — a structural description of a fiscal mechanism. The next post examines the same mechanism operating at the most peripheral level of the empire: the small colonial territory that never featured in the rhetoric of imperial greatness but appeared every year in the Colonial Office accounts, consuming British administrative expenditure while generating primary commodities at wage levels that a Metropolitan economist could barely imagine.