Key Takeaways#
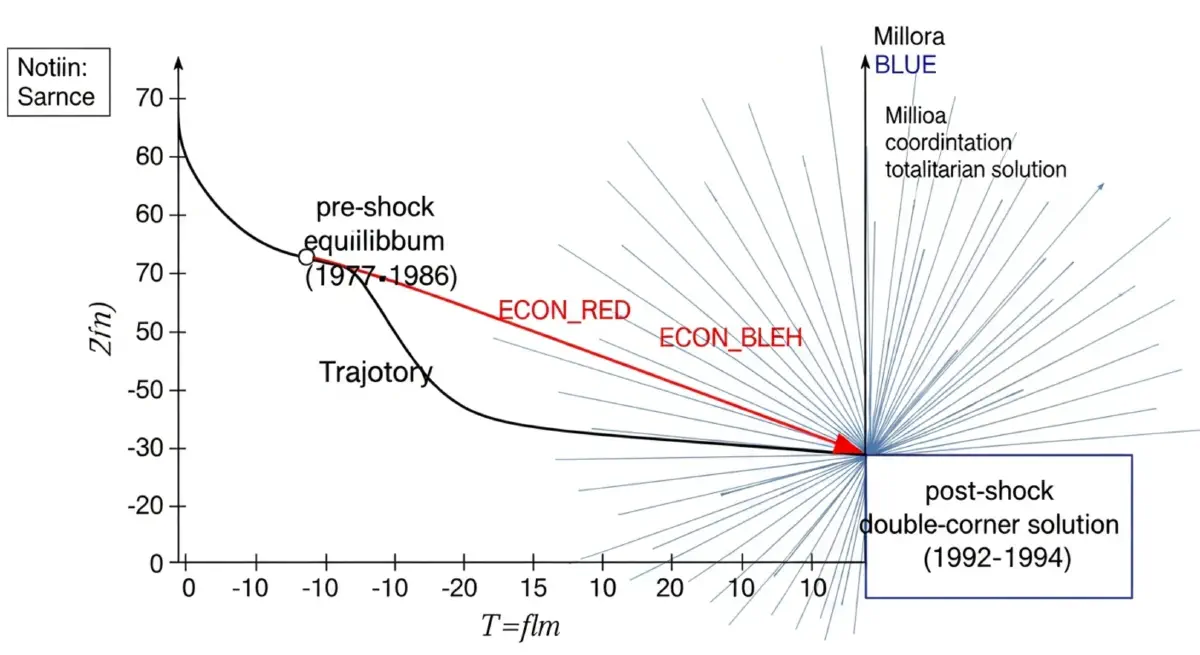
- The “double-corner solution” in the Wintrobe model describes an equilibrium where the dictator maximizes repression against one population group while simultaneously maximizing a different group’s ideologically produced loyalty — at near-zero marginal cost.
- Philip Verwimp’s commune-level regression is the quantitative proof: controlling for Tutsi population share, communes where coffee land concentration was highest experienced the most intensive killing. The killing was organized through the same administrative infrastructure built to distribute coffee rents.
- RTLM Radio Télévision Libre des Mille Collines, founded in 1993, was a loyalty production machine. Its operating cost was financed partly through tea plantation revenue pledges made by regime insiders — the same elite that had managed coffee revenues through OCIR-Café. The transition from one commodity to another is literal.
- The Arusha Accords of August 1993, which required genuine power-sharing with the RPF, were incompatible with the Northern Hutu hardliner coalition’s economic position. Signing the Accords without intending to implement them was itself a political act consistent with Wintrobe’s model: buying time while the militia substitution preparation continued.
- The shooting down of Habyarimana’s plane on April 6, 1994 — whoever was responsible — served as the trigger that activated a pre-planned organizational apparatus, not as the cause of improvised violence. The organizational infrastructure for genocide had been assembled over four years.
- The commune-level data links the economic geography of the crisis to its human geography: the places that suffered most were not the places with the most Tutsi residents. They were the places where the political economy of coffee had been most deeply institutionalized.
The Model’s Prediction#
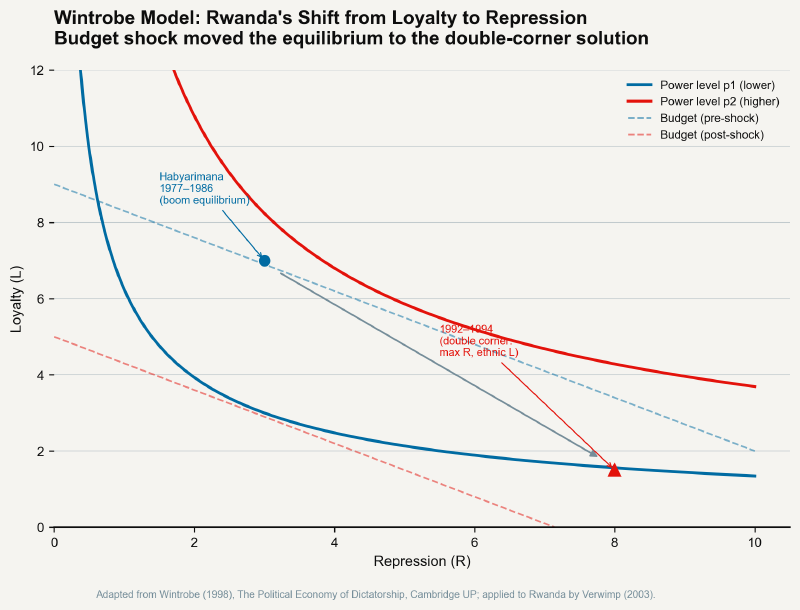
Ronald Wintrobe’s model generates a specific prediction for a totalitarian dictator facing a collapsing loyalty budget. The dictator does not simply increase repression against existing opponents — that would be the tinpot’s emergency response, deployed to maintain a reduced but sustainable power level. The totalitarian dictator finds a cheaper production function for the same level of power.
Ethnic ideology is cheaper than economic distribution in two specific ways that the model captures precisely. First, its marginal cost is near zero: once the ideological infrastructure is in place (the radio station, the pamphlets, the militia training), additional units of loyalty can be produced at negligible expense — unlike the coffee producer price, which required a material transfer per kilogram per farmer. Second, it is self-reinforcing in a way that purchased loyalty is not: ethnic identity, unlike a price floor, cannot be undercut by a competing patron. The RPF could not offer Hutu farmers a higher coffee price to defect. The loyalty produced by ethnic mobilization was structurally exclusive.
The Organizational Transfer#
flowchart LR
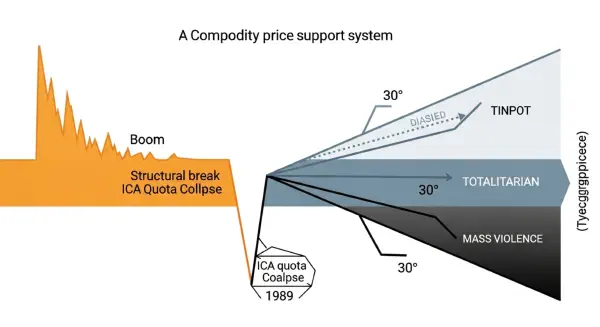
A["Coffee price collapse\n1987-1989"] --> B["Subsidy budget exhausted\n1992-1993"]
B --> C["Loyalty supply declines\n(economic basis gone)"]
C --> D["Wintrobe totalitarian response:\nfind cheaper loyalty input"]
D --> E["Hutu Power ideology\n(RTLM Radio, 1993)"]
D --> F["Interahamwe militias\n(recruited in high-coffee\ncommunities, 1991-1993)"]
E --> G["Ideological loyalty:\nnear-zero marginal cost"]
F --> H["Repression capacity:\nmilitia-based, cheap"]
G --> I["Double-corner equilibrium:\nHutu loyalty maximized\nTutsi repression maximized"]
H --> I
I --> J["Genocide: April-July 1994\n~800,000 deaths in 100 days"]
The administrative infrastructure built to distribute coffee rents did not need to be redesigned to organize mass violence. It needed to be redirected. The commune monitors who had advised farmers on cultivation practices and levied fines for uprooting trees were the same functionaries who, from 1990 onward, compiled lists, managed roadblocks, and coordinated with interahamwe commanders. The MRND cell structure, which had enrolled every Rwandan and tracked their party participation, provided the organizational granularity required to identify, locate, and kill at the household level.
Verwimp’s regression finding — that coffee land concentration predicts killing intensity after controlling for Tutsi population share — is precisely this organizational transfer made statistically visible. High coffee communes were not places where ethnic hatred was more intense. They were places where the organizational density of the loyalty-distribution apparatus was highest, and therefore where its violent successor application was most efficiently executed.
What the Numbers Show#
The rate of killing during the Rwandan genocide was historically without parallel. More people were killed per day than in any other genocide for which we have reliable records — including the Holocaust, which killed more people in total but over a longer period using industrial technology. The Rwandan genocide was conducted primarily with machetes and farm tools, by ordinary people organized through local administrative structures, operating according to lists compiled through the same cell-level MRND network that had organized compulsory communal labor and coffee monitoring.
This organizational efficiency is not an ethnic phenomenon. It is an institutional one. The Habyarimana regime had spent twenty years building one of the most penetrating administrative structures in sub-Saharan Africa — a structure designed to extract and distribute agricultural rents at the household level. When the rent ran out, the structure remained. It was, in the domain of human organization, a sunk cost. The question was only what it would be used for next.
The Arusha Problem#
The August 1993 Arusha Accords required Habyarimana to implement genuine power-sharing: the RPF would receive cabinet posts, a combined transitional government would govern until elections, and the armed forces would be integrated. The international community treated the signing as resolution. It was not.
From the Wintrobe model’s perspective, the Arusha terms were impossible for a specific reason unrelated to ethnic ideology. The northern Hutu elite that constituted Habyarimana’s core loyalty coalition had received their political rents precisely because the state was ethnically exclusionary at the access level. Opening state positions to RPF-aligned politicians would not just dilute their power — it would eliminate the mechanism through which their loyalty was purchased. There was no economic offer Habyarimana could make that would compensate his coalition for what Arusha required them to give up.
The Forensic Conclusion#
The Verwimp paper’s central contribution is not to demonstrate that economic factors caused the genocide — that would be reductionist beyond what the data supports. Its contribution is to demonstrate that the genocide’s spatial pattern cannot be explained by ethnic geography alone, and that the residual explanatory variable — coffee land concentration — is precisely the variable predicted by a political economy model of dictatorship under budget stress.
Genocide emerged as the Wintrobe model’s double-corner solution. It was not the only possible outcome: a tinpot dictator would have taken a different path, at a different cost. But given Habyarimana’s type — established by his behavior during the 1976–1979 boom — and given the specific political trap created by the northern Hutu coalition’s economic position, the model predicts the outcome with uncomfortable precision.
This is not determinism. Specific decisions made by specific individuals in April 1994 were necessary for the killing to begin. The ideology, the radio, the militias — all were necessary. The claim is that the price of coffee, set in institutional arrangements managed from Geneva and Washington, created the material conditions that made each of those specific decisions rational for the actors who made them. The distal cause was financial. The human cost was 800,000 lives.
References#
Verwimp, P. (2003). The political economy of coffee, dictatorship, and genocide. European Journal of Political Economy, 19(1), 161–181. https://doi.org/10.1016/S0176-2680(02)00166-0
Wintrobe, R. (1998). The political economy of dictatorship. Cambridge University Press.
Desforges, A. (1999). Leave none to tell the story: Genocide in Rwanda. Human Rights Watch. https://www.hrw.org/legacy/reports/1999/rwanda/
Prunier, G. (1995). The Rwanda crisis: History of a genocide. Columbia University Press.
International Criminal Tribunal for Rwanda (ICTR). (2003). Prosecutor v. Ferdinand Nahimana et al. (Media Case). ICTR-99-52-T. https://unictr.irmct.org/en/cases/ictr-99-52
Mfizi, C. (1992). Le réseau zéro (Open letter to the MRND). Kigali.
United Nations. (1994). Report on the situation of human rights in Rwanda (S/1994/1125). UN Security Council.