The Budget Line That Always Gives Way#
When a government faces a fiscal consolidation requirement — the standard IMF program condition for countries in debt distress — it must reduce expenditure, increase revenue, or both. In practice, developing-country governments in crisis do both: they raise taxes on consumption (regressive, but administratively fast) and they cut expenditure. The expenditure cuts do not fall uniformly across budget lines. They follow a predictable logic.
Debt service cannot be cut. It is a contractual obligation, and the entire purpose of the IMF program is to restore the country’s ability to meet that obligation. Military expenditure is politically difficult to cut in countries where the armed forces are a significant domestic political constituency — which is most of the countries under consideration. Capital expenditure on large infrastructure projects can be suspended, but doing so creates contractor liabilities, unemployment, and political exposure of its own.
What remains is recurrent expenditure on social services: the public sector wage bill for teachers, nurses, and doctors; subsidies on fuel and food; transfers to the poor. These can be reduced within a budget cycle without creating the immediate political crisis that suspending a debt payment or dismissing the military would create. The cost is distributed across millions of households too dispersed and too poor to have the lobbying power that creditors command.
The SSDR League Table#
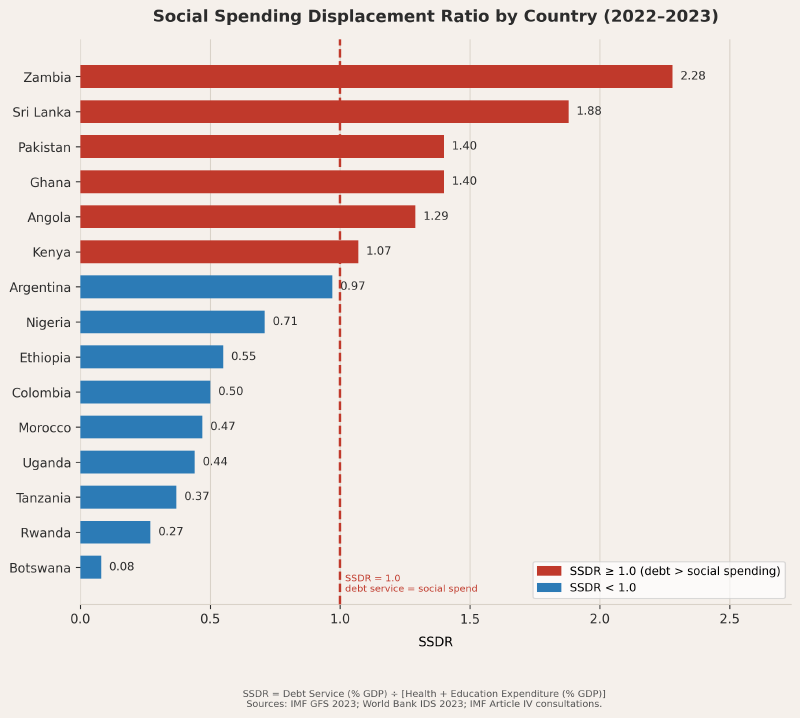
The Social Spending Displacement Ratio, introduced in this series, is defined as:
SSDR = Annual Debt Service (% of GDP) ÷ [Health Expenditure + Education Expenditure] (% of GDP)
An SSDR above 1.0 means the government spends more servicing debt than it spends on health and education combined. The full league table for 2022–2023, using IMF GFS and World Bank IDS data, ranks fifteen countries as follows:
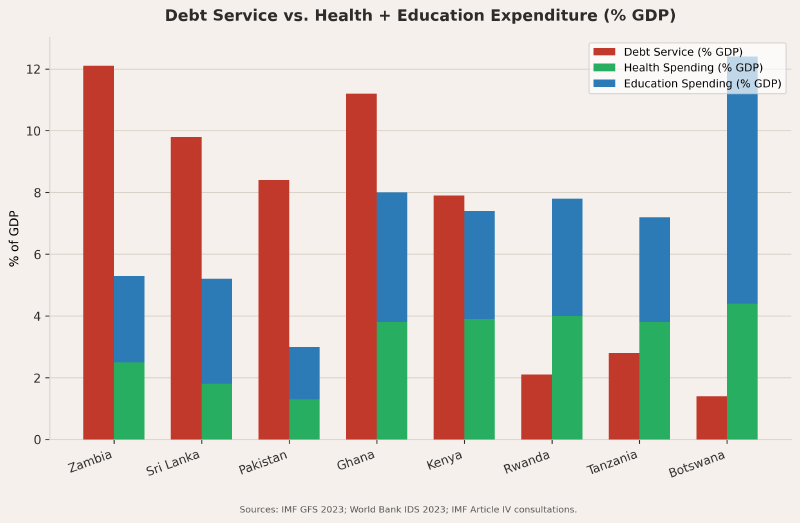
| Country | Debt Service | Health | Education | SSDR |
|---|---|---|---|---|
| Zambia | 12.1% | 2.5% | 2.8% | 2.28 |
| Sri Lanka | 9.8% | 1.8% | 3.4% | 1.88 |
| Pakistan | 8.4% | 1.3% | 1.7% | 1.40 |
| Ghana | 11.2% | 3.8% | 4.2% | 1.40 |
| Angola | 10.6% | 3.0% | 5.2% | 1.29 |
| Kenya | 7.9% | 3.9% | 3.5% | 1.07 |
| Argentina | 7.2% | 7.0% | 4.8% | 0.97 |
| Nigeria | 6.1% | 3.8% | 4.8% | 0.71 |
| Ethiopia | 3.2% | 2.8% | 3.0% | 0.55 |
| Colombia | 5.3% | 7.4% | 3.1% | 0.50 |
| Morocco | 4.6% | 4.6% | 5.1% | 0.47 |
| Uganda | 3.3% | 2.8% | 3.5% | 0.44 |
| Tanzania | 2.8% | 3.8% | 3.4% | 0.37 |
| Rwanda | 2.1% | 4.0% | 3.8% | 0.27 |
| Botswana | 1.4% | 4.4% | 8.0% | 0.08 |
Six of fifteen countries analyzed have SSDRs above 1.0. All six are countries with active or recent IMF programs. The SSDR framing makes visible what the debt-to-GDP framing conceals: the annual flow consequence of the debt, not merely its stock, and specifically where that consequence lands in the operating budget.
What the IMF’s Own Evaluations Say#
The IMF’s Independent Evaluation Office (IEO) has published a series of assessments of the fund’s structural adjustment programs that are worth reading carefully, because they are the IMF’s own staff documenting the IMF’s record.
The 2011 IEO assessment of IMF programs in Sub-Saharan Africa found that approximately 60 percent of programs in the region did not achieve their projected GDP growth outcomes. Programs that required fiscal consolidation in low-income countries frequently produced immediate contractionary effects — reduced domestic demand, lower investment, higher unemployment — that offset or outweighed the stabilization benefits. The fund’s standard response, when programs fail to achieve growth targets, has been to attribute the failure to incomplete implementation of structural reforms rather than to the design of the conditionality itself.
The 2019 Oxfam analysis of eighteen IMF programs (“The Suffering of Others”) found consistent patterns:
- Public health worker hiring freezes were documented in Zambia, Ghana, and Mali as direct budget effects of IMF conditionality requirements.
- Education ministry budget reductions averaging 14 percent were documented across the eighteen programs reviewed.
- Fuel subsidy removal — a standard IMF structural reform — was implemented in Nigeria (2012), Egypt (2016), and Pakistan (2023), in each case producing an inflationary shock that disproportionately affected the lowest-income quintile, the population least able to absorb price increases on cooking fuel and transport.
These outcomes are not inconsistent with the IMF’s own stated logic. Fuel subsidies are economically inefficient. Bloated public sector wage bills do reduce fiscal space. The IMF’s prescriptions are defensible within a framework that prioritizes macroeconomic stabilization as the precondition for growth. The question is what is being stabilized at what cost, measured against what alternative.
Zambia: The Health System Arithmetic#
Zambia’s doctor-to-population ratio as of the most recent available data is approximately 1 per 11,000 people. The WHO’s recommended minimum is 1 per 1,000. In absolute terms, Zambia has roughly one-eleventh of the medical personnel needed to provide basic health coverage to its 19 million people.
This is not a new condition created by the 2020 default. It is a structural condition that has been building for decades through the compound effect of debt service displacing the health budget. In 2019, Zambia’s total public health expenditure was approximately $750 million. Its debt service was approximately $1.7 billion. The additional $750–850 million in health spending needed to approach the WHO standard was not available — not because Zambia chose not to spend it, but because it had been pre-committed to creditors.
The IMF’s 2020 Article IV consultation with Zambia noted the “critical need” for increased health and education spending. It noted this in the same document that required fiscal consolidation as a condition of program participation. The tension was not resolved. It was documented and then treated as a political economy challenge for the Zambian government.
Pakistan: The Education Emergency#
Pakistan’s education spending in 2023 was 1.7 percent of GDP. The global average is approximately 4.5 percent. The UNESCO benchmark for adequate basic education coverage is 4–6 percent of GDP. Pakistan’s interest payments in 2023 were 7.7 percent of GDP — the single largest line item in the entire federal budget, exceeding defence (2.6%), development expenditure (2.3%), and social protection combined.
Twenty-six million Pakistani children are currently not in school. That figure — the highest in the world in absolute numbers after Nigeria — is the structural consequence of a budget in which debt service consumes the fiscal space that would otherwise fund teachers, classrooms, and the educational infrastructure of a country of 240 million people.
Pakistan has had twenty-three IMF programs. Each has included structural benchmarks on revenue collection and expenditure control. None has systematically addressed the currency composition of the debt (still predominantly external and dollar-denominated), the interest rate spread (7–10 percent for Pakistan versus less than 2 percent for OECD borrowers of comparable maturity), or the structural dependence on cotton textile exports that makes export revenues vulnerable to the same commodity-price and climate variables that have trapped other countries in the Double Bind described in Part 1.
Ghana: SSDR 1.40 After HIPC#
Ghana completed the HIPC Initiative — the international debt cancellation program for heavily indebted poor countries — in 2004. Its debt was reduced from approximately 95 percent of GDP to approximately 40 percent. Between 2004 and 2020, it was cited repeatedly as an African success story. It issued its first sovereign Eurobond in 2007, at a yield of 8.5 percent, to international acclaim.
By 2022, Ghana’s debt-to-GDP ratio had returned to approximately 100 percent, and its SSDR had reached 1.40. The rebound mechanism was not recklessness in the colloquial sense. It was a combination of Eurobond issuance at commercial rates to fund operating expenditures (capital flight from commodity revenue gaps), COVID-19 revenue collapse, dollar appreciation on a predominantly dollar-denominated debt stock, and an IMF program in 2023 that required fiscal consolidation just as the health system was recovering from the pandemic.
Ghana’s HIPC completion did not change its structural exposure to the Double Bind. It cleared the stock. It did not address the flow dynamics — the export concentration in gold and cocoa, the dollar-denominated borrowing, the absence of a deep local-currency bond market — that reliably generate new debt accumulation when the external terms of trade turn.
The IMF’s Lens and Its Limits#
The IMF’s core metric — the debt sustainability analysis, with its debt-to-GDP threshold framework — was designed to answer a specific question: is this country’s debt stock manageable relative to the size of its economy? It was not designed to answer the question the SSDR asks: what is annual debt service displacing in the operating budget, and what is the human cost of that displacement?
These are different questions, and they produce different policy conclusions. Debt-to-GDP analysis might show a country at moderate risk while its SSDR exceeds 1.0 — because the stock is distributed, but the annual flow is concentrated in a single budget period. Conversely, a country with a high SSDR might have a debt-to-GDP ratio that appears manageable by IMF standards while spending less on health and education than it owes per year in interest.
The policy implication is not that debt-to-GDP analysis is wrong. It is that SSDR analysis needs to be conducted alongside it, as a mandatory component of the IMF’s Article IV consultations, with quantitative targets for social spending as non-waiveable program conditions, not merely as aspirational references in the text of the consultation report.
That change has not been made. As of 2026, the IMF’s Article IV template continues to include social spending as one item among many in the fiscal analysis section. The SSDR threshold — the point at which a government is paying more to creditors than to keep citizens alive and educated — has no automatic trigger in the fund’s standard program design.
References#
- IMF Independent Evaluation Office. Structural Conditionality in IMF-Supported Programs. 2007. https://ieo.imf.org
- Oxfam International. “The Suffering of Others: The Human Cost of the IMF’s Covid-19 Lending.” 2021. https://www.oxfam.org
- IMF Government Finance Statistics. https://data.imf.org/?sk=a0867067-d23c-4ebc-ad23-d3b015045405
- World Bank. International Debt Statistics 2024. https://data.worldbank.org/topic/external-debt
- Pakistan Ministry of Finance. Budget Statement 2023–24. https://www.finance.gov.pk
- UNICEF. “Education Brief: Pakistan.” 2023. https://www.unicef.org/pakistan/education
- Ghana Ministry of Finance. “2023 Mid-Year Fiscal Policy Review.” 2023.
- Zambia Ministry of Health. Annual Health Statistical Bulletin 2022.
- IMF. Article IV Consultation — Zambia 2020; Ghana 2023; Pakistan 2023.