The Arithmetic of the Trap#
On 13 November 2020, Zambia became the first African country to default on its sovereign debt during the COVID-19 pandemic when it missed a $42.5 million coupon payment on its Eurobonds. The announcement triggered a familiar cycle of headlines: governance failures, fiscal recklessness, a country living beyond its means. The IMF dispatched a team. The G20 convened discussions. The president of the World Bank gave a speech about debt sustainability.
The standard narrative, deployed in the same form for forty years from Mexico in 1982 to Sri Lanka in 2022, attributes sovereign debt distress to a failure of domestic governance — to the political economy of populist spending, the weakness of institutions, the corruption of elites. That narrative is not entirely wrong. But it is structurally incomplete. It misidentifies the mechanism.
Zambia’s debt crisis was not produced by reckless spending in the years before default. It was produced by a specific arithmetic construction: a country that earns its foreign exchange in a commodity whose price it does not control, borrows in a currency it does not issue, at interest rates calibrated for its risk by creditors in London and New York, and then encounters the simultaneous shock of dollar appreciation and commodity price collapse. Each of those variables is structural. None of them is correctable by a change of government.
Zambia: A Case Study in Structural Exposure#
The Commodity Dependency#
Copper accounts for approximately 70% of Zambia’s export earnings. It follows that Zambia’s capacity to service foreign-currency-denominated debt is a direct function of the global copper price. This is not a governance decision. It is a legacy of an extractive colonial economy that was never structurally diversified during the period of independence.
The copper supercycle that began in the early 2000s — driven by Chinese infrastructure demand — produced a sustained period of high export revenues. Zambia borrowed accordingly, in the reasonable expectation that revenue growth would continue. Between 2012 and 2015, the country issued $3 billion in Eurobonds, raising money at yields of approximately 5.6 to 8.6 percent. The borrowing funded infrastructure — roads, hospitals, an airport — that its creditors publicly praised.
In 2014, the commodity supercycle ended. Copper prices fell from approximately $3.20 per pound in early 2014 to $2.10 by late 2015 — a decline of 35 percent in eighteen months. Zambia’s export revenues contracted sharply. The foreign exchange needed to service its dollar-denominated debt became more expensive to obtain at the precise moment that debt service obligations were growing with the issuance calendar.
The Dollar Amplifier#
During 2021 and 2022, the US Federal Reserve responded to domestic inflation with the most aggressive tightening cycle in forty years. The DXY dollar index — a measure of dollar strength against a basket of major currencies — rose approximately 27 percent between January 2021 and October 2022. For every country that had borrowed in dollars and earned in local currency, this appreciation constituted an automatic increase in the real burden of their debt.
Zambia’s kwacha fell approximately 44 percent against the dollar in the years surrounding its default. A debt obligation of $100 million, serviced from kwacha revenues, required 44 percent more kwacha after the depreciation than before. The face value of the debt did not change. The capacity to service it did. The mechanism is not default risk in the credit-analysis sense — it is a currency mismatch built into the structure of the borrowing itself, and it is unavoidable for countries that must borrow in dollars because their domestic bond markets lack the depth to absorb large sovereign issuances in local currency.
Introducing the Social Spending Displacement Ratio#
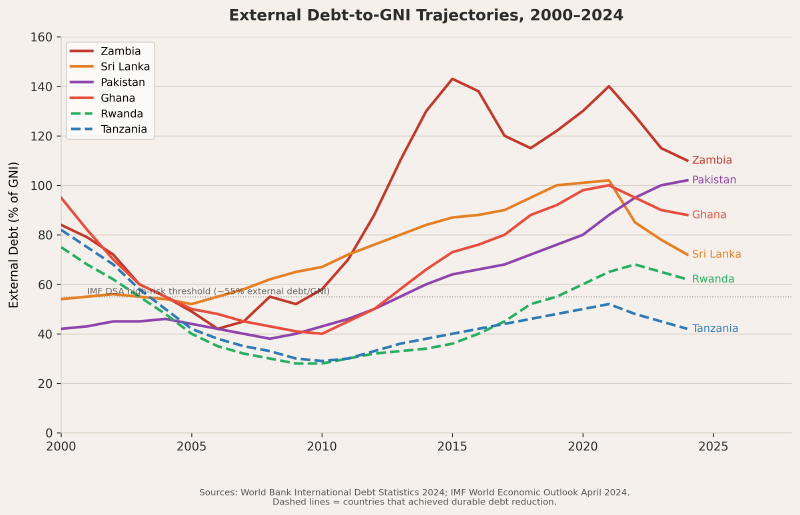
The conventional metric for debt sustainability is debt-to-GDP — how large is the total stock of debt relative to the size of the economy. The IMF’s debt sustainability analysis (DSA) framework flags a country as “high risk” when its external debt exceeds approximately 55 percent of GNI. Zambia breached that threshold in 2014. By 2016 it was at 88 percent. By 2019, 143 percent.
These numbers describe a stock problem. They do not describe a flow problem — they do not tell you what is being displaced, year by year, in the government’s operating budget as debt service absorbs an increasing share of revenue. For that, you need a different metric.
The Social Spending Displacement Ratio (SSDR) is defined as:
SSDR = Annual Debt Service (% of GDP) ÷ [Health Expenditure + Education Expenditure] (% of GDP)
An SSDR of 1.0 means a government spends exactly as much servicing debt as it spends on health and education combined. An SSDR above 1.0 means debt service has displaced social spending as the primary call on public revenue.
In 2019, the year before Zambia’s default, its SSDR was 2.28. Zambia paid creditors $2.28 for every $1.00 it spent on health and education combined. Its total public health expenditure that year was $750 million. Its debt service was $1.7 billion.
That ratio does not describe a governance failure in the conventional sense. It describes the outcome of a structural position — commodity-dependent export base, dollar-denominated debt, externally set interest rates — that a competent government would have struggled to escape and an incompetent one had no chance of managing.
Sri Lanka: The Tourism-Commodity-Dollar Triangle#
Sri Lanka’s April 2022 default — the first in the country’s postcolonial history — was attributed by most international commentary to the Rajapaksa government’s 2019 decision to cut taxes by approximately 1.5 percent of GDP, reducing government revenues by roughly a third. The tax cuts were reckless and their timing was disastrous. They are not, however, a sufficient explanation for what happened.
Sri Lanka’s foreign exchange earnings in 2019 came from three primary sources: tourism revenues (approximately $4.3 billion), worker remittances from Gulf expatriate workers (approximately $6.7 billion), and garment exports (approximately $5.3 billion). In 2020, COVID-19 effectively eliminated tourism. The Gulf economy contracted, reducing remittances. Global supply chain disruption hurt garment exports. All three primary sources of foreign exchange contracted simultaneously, through no domestic policy decision, in the same year that a new government had reduced the tax revenues that might otherwise have covered the shortfall.
By April 2022, Sri Lanka’s foreign exchange reserves had fallen to approximately $50 million — less than one week of import costs. The country could not afford to import the diesel that powered its electricity grid. Hospitals ran short of medicines. Cooking gas disappeared from shelves. The lines outside petrol stations stretched for five hundred meters.
Sri Lanka’s debt-to-GDP ratio in 2021 was 101 percent — high, but comparable to many advanced economies including Japan and Italy, neither of which has ever defaulted. The difference was the currency composition of the debt (approximately 60 percent external, predominantly in dollars and yen), the maturity profile (large bullet repayments due in 2022 and 2023), and the complete evaporation of the export revenues intended to service it. The government’s tax cut was the final variable in an equation that had too many structural terms pointing in the same direction.
Pakistan: The IMF’s Longest Customer#
Pakistan has had twenty-three IMF programs since 1958. It is the IMF’s most persistently recurring client. As of 2024, Pakistan’s external debt stands at approximately $130 billion. Its foreign exchange reserves in January 2023 fell to $4 billion — less than three weeks of imports, triggering the country’s twenty-third IMF engagement.
Pakistan’s structural position is distinctive in one respect: it is a nuclear power with significant geopolitical leverage, which means its creditors — both bilateral and multilateral — have a strong interest in preventing a chaotic default, and Pakistan has used that leverage consistently to refinance rather than restructure. The result is a country that has not defaulted but has also not escaped. Its debt service as a percentage of GDP was 8.4 percent in 2023. Its education spending was 1.7 percent — the second-lowest in the world in absolute terms for a country of its size. Its SSDR was 1.40.
Twenty-six million Pakistani children are currently out of school. The country’s debt to creditors who lent at commercial rates to a nuclear state with geopolitical leverage is displacing the education spending that would allow the country to generate the skilled workforce that might eventually diversify an export base still heavily dependent on cotton textiles.
The arithmetic closes itself.
The Mechanism, Named#
The Double Bind is a specific structural configuration, not a metaphor:
- Commodity dependency — export revenues are denominated in, and priced by, global markets the country does not influence.
- Dollar borrowing — capital market access is available only in currencies the country does not issue.
- External interest rates — borrowing costs are set by creditor markets that price political and macroeconomic risk, producing rates of 7–12 percent for frontier markets versus 1–3 percent for the same maturity in advanced economies.
- Dollar appreciation — Federal Reserve tightening cycles automatically increase the real burden of all dollar-denominated debt held by non-dollar earners.
- Commodity price collapse — the end of commodity supercycles simultaneously reduces FX revenues and increases the effective cost of debt service.
- IMF conditionality — the emergency rescue mechanism requires fiscal consolidation that restricts the very social spending whose displacement the SSDR measures.
Each of these mechanisms operates independently of domestic governance quality. A government that borrows in dollars when that is the only option available, at the market rate for its risk category, to fund infrastructure praised by its creditors, and then encounters a dollar strengthening cycle and commodity price fall, has not made a mistake by the standards available to it at the time of borrowing. It has fallen into a structural position.
The distinction matters for policy. If the cause is governance, the solution is institution-building and anti-corruption measures — the standard IMF prescription. If the cause is structure, the solution requires changing the structure: building local currency bond markets, diversifying export bases, reforming the international interest rate architecture for developing-country borrowing, and — critically — building restructuring mechanisms that work before the crisis becomes acute rather than after. The next four posts examine each dimension of what would need to change, and what evidence exists that change is possible.
References#
- World Bank International Debt Statistics 2024. https://data.worldbank.org/topic/external-debt
- IMF Article IV Consultation — Zambia, 2020 and 2023. https://www.imf.org/en/Publications/CR
- Zambia Ministry of Finance, Budget Statements 2018–2022.
- IMF Article IV Consultation — Sri Lanka, 2022.
- State Bank of Pakistan. Annual Report 2023. https://www.sbp.org.pk
- BIS. “Dollar Appreciation and Emerging Market Debt Burdens.” BIS Quarterly Review, March 2023.
- Reinhart, Carmen M., and Kenneth S. Rogoff. This Time Is Different. Princeton University Press, 2009.