Between June and December 2014, the price of Brent crude fell from $115 to $57 per barrel. It was not expected. The International Energy Agency’s 2013 World Energy Outlook had projected prices remaining above $100 through 2035. OPEC had not reduced its production targets. Analysts at Goldman Sachs, Citigroup, and the World Bank had spent the preceding two years arguing that the structural demand from China’s industrialization had created a “new normal” of permanently elevated commodity prices. They were wrong by the margin of an entire economic paradigm. When US shale production scaled faster than anyone had publicly projected and Chinese construction growth decelerated earlier than anyone had admitted to their clients, the super-cycle ended — not gradually, but in a single trading quarter. The governments that had borrowed against it had no warning that was operationally useful.
Key Takeaways#
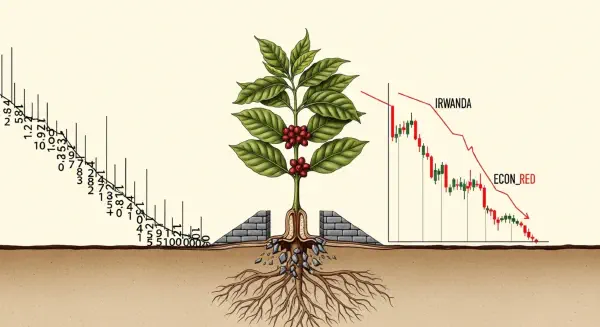
- Between June 2014 and January 2016, crude oil fell 73%, copper fell 50%, and coffee fell 45% from their super-cycle peaks. The synchronized nature of the commodity collapse — affecting oil, metals, and agricultural exports simultaneously — meant that no commodity-dependent economy could cushion one exposure through another.
- Zambia’s kwacha depreciated 75% against the US dollar in the twelve months following the copper price peak in 2014. Its external debt-to-GDP ratio, borrowed in dollars during the boom, rose from 20% to over 100% over the following six years as the real burden of dollar-denominated debt compounded against falling revenues.
- Nigeria’s 2015–2016 recession — the first since the 1987 oil collapse — coincided precisely with Boko Haram reaching its maximum territorial extent in the northeast, controlling an area roughly the size of Belgium. States that could not pay the salaries of their security forces were states that could not maintain territorial control.
- Sudan’s Omar al-Bashir governed for 30 years on oil rents. When South Sudan’s 2011 secession removed 75% of the oil fields, the fiscal foundations of the regime disappeared over three years. Hyperinflation reached 340% by 2021. Al-Bashir was removed in a coup in 2019, triggering a chain of instability that produced a full civil war by 2023 and the displacement of more than 8 million people.
- Venezuela, despite holding the world’s largest proven oil reserves, had an economy that functionally ceased to generate non-oil GDP during the Maduro period. When oil revenues collapsed after 2014, the government printed money rather than adjust. By 2019, GDP had contracted 65% from its 2013 peak — a contraction exceeding that of the United States during the Great Depression.
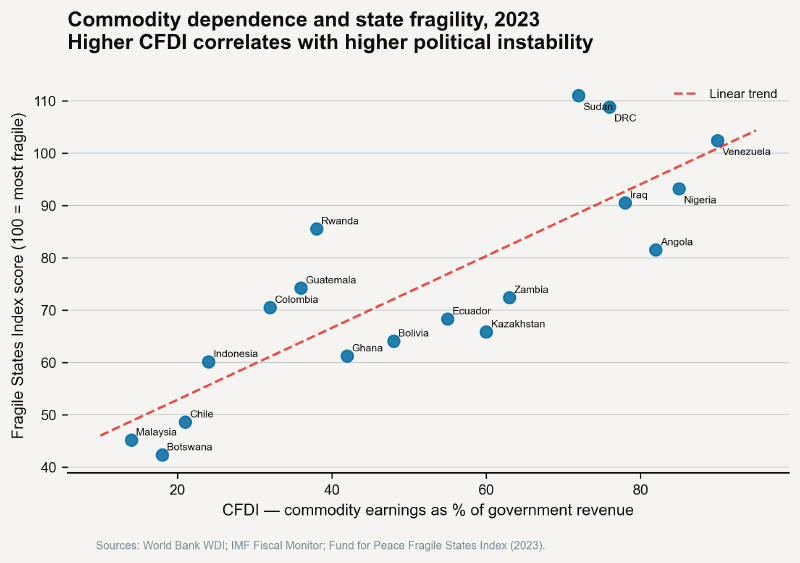
- The super-cycle was not neutral in its effects: it deepened fiscal dependence, enlarged government payrolls, enabled borrowing at favorable spreads, and created political commitments that could not be met from lower revenues. The boom did not make high-CFDI states more resilient. It made the bust more severe.
How the Same Starting Point Produced Different Disasters#
Three countries entered the super-cycle bust with similar structural vulnerabilities and produced crises of different character. Zambia defaulted on its sovereign debt. Nigeria experienced its deepest recession since the 1980s, accompanied by armed insurgency. Sudan experienced political revolution and civil war. The differences reflect specific institutional features of each country’s commodity architecture, but they confirm the same underlying mechanism: when the revenue base disappears, the political arrangements built on it must renegotiate themselves, and those renegotiations are rarely orderly.
Zambia: The Copper Trap in One Accounting Period#
Zambia’s relationship with copper is not a metaphor. Copper literally built the country: the Copperbelt towns of Ndola, Kitwe, and Chingola were the economic heart of the colonial economy and remained so at independence. ZCCM, the state copper company, employed directly or indirectly most of the formal workforce. When copper prices collapsed in the 1970s following the first oil shock, Zambia entered a 25-year contraction from which it did not emerge until the super-cycle began.
The super-cycle appeared, for a decade, to be the resolution. GDP growth averaged 7.4% per year from 2005 to 2014. The government issued Zambia’s first sovereign Eurobond — $750 million at 5.375% — in 2012, at a moment when copper was trading above $4 per pound and investor appetite for African sovereign paper was at a multi-decade peak. Two further Eurobonds followed. Total external debt rose from $3.0 billion in 2012 to $12.0 billion by 2020.
When copper fell from $4.00 to $2.11 per pound between 2011 and 2016, the arithmetic turned inside out. The debts were denominated in dollars; the revenues available to service them were copper-denominated and copper-price-sensitive. The kwacha, depreciating 75% against the dollar in one year, had the effect of doubling the real cost of debt service in domestic currency terms. The government began missing coupon payments in 2020. It formally defaulted in November 2020 — the first Sub-Saharan African sovereign default of the COVID era, though COVID was not the cause. The cause was copper, borrowing, and arithmetic.
Nigeria: The Fiscal State and the Security State#
Nigeria’s bust exposed something different. The country had used its super-cycle windfall not to diversify its economy, but to expand its public payroll. Federal and state government employment rose substantially between 2005 and 2014. State governments, receiving large allocations from the federation account, became the dominant employers in their regional economies. The salaries of teachers, nurses, police officers, and soldiers depended on commodity transfers from the federal level.
When the oil price fell in late 2014, federal allocations to states contracted sharply. By early 2015, 27 of Nigeria’s 36 states had salary arrears — teachers and police officers going unpaid for three to five months at a stretch. In Borno and Yobe states, where Boko Haram was most active, this produced a direct operational problem: the counterinsurgency effort depended on state police forces and vigilante groups whose members were owed months of back pay. Recruitment to the insurgency, which paid in cash, became relatively more attractive in precisely the communities the government needed to hold.
Nigeria did not collapse. Its institutional density — a central bank willing to defend the naira, a federal structure that distributed political shocks, a commercial economy diverse enough to absorb a 10% GDP contraction without total fiscal failure — provided a degree of resilience absent in Zambia or Sudan. But the 2015–2016 recession demonstrated with clarity that the rentier structure had created an economy incapable of generating the revenues necessary to maintain a security state when the rents disappeared.
Sudan: Thirty Years on Oil, Six Months Without It#
Sudan’s case is perhaps the most direct illustration of the commodity curse. Omar al-Bashir came to power in 1989 — the same year Rwanda’s coffee economy began collapsing — in a military coup. He governed for three decades through a combination of oil rents, military patronage, and the systematic exclusion and violence against peripheral populations that culminated in the Darfur genocide, which the International Criminal Court indicted him for in 2009.
The fiscal structure was simple. Oil revenues funded the security apparatus. The security apparatus protected the regime. The regime negotiated — or did not negotiate — the distribution of rents to regional elites and military commanders. When South Sudan voted for independence in 2011 and took 75% of the oil fields with it, the structure lost its foundation.
The fiscal numbers over the three years following South Sudan’s secession are among the most dramatic available in the World Bank’s data. Sudan’s oil export revenues fell from over 50% of government income in 2010 to under 10% by 2013. The government attempted to compensate through money creation. Annual inflation rose from approximately 18% in 2012 to over 55% in 2013, accelerating to 340% by 2021. The political coalition held for nearly a decade through a combination of military force and shrinking distributions — until December 2018, when the price of bread tripled following subsidy removal and protests began. Al-Bashir was removed in April 2019.
The Bust as a Political Settling of Accounts#
What the 2014–2016 commodity bust confirmed, across three continents and three commodity sectors, was that the super-cycle had not resolved fiscal dependence. It had deepened it — by enabling borrowing that created fixed future obligations, by expanding public payrolls that created political commitments, and by raising commodity-dependent governments’ credit ratings to the point where international capital markets would lend them money for projects with no clear path to commodity-independent repayment.
The instability that followed the bust was not a failure of governance in the ordinary sense. It was an accurate readout of what these states actually were: commodity distribution machines whose political stability was a function of the commodity price, not of durable institutional capacity.
Part 4 will examine the instrument that was supposed to correct this — the IMF structural adjustment program — and what the evidence shows about what it actually did.
References#
IMF. (2024). Primary commodity prices. International Monetary Fund. https://www.imf.org/en/Research/commodity-prices
World Bank. (2024). World development indicators: Zambia, Nigeria, Sudan 2005–2023. https://databank.worldbank.org
International Energy Agency. (2013). World energy outlook 2013. IEA Publications.
Eurodad. (2021). Zambia’s debt crisis. European Network on Debt and Development. https://www.eurodad.org/debt_justice
Fund for Peace. (2023). Fragile States Index 2023. https://fragilestatesindex.org/data/
International Crisis Group. (2019). Safeguarding Sudan’s revolution. Africa Report No. 281. International Crisis Group. https://www.crisisgroup.org/africa/horn-africa/sudan/281-safeguarding-sudans-revolution
Nossiter, A. (2015). In Nigeria, oil-fueled economy falters as crude prices drop. International New York Times.
Sachs, J. D., & Warner, A. M. (1995). Natural resource abundance and economic growth (NBER Working Paper No. 5398). https://doi.org/10.3386/w5398