In 1972, the King of Bhutan, Jigme Singye Wangchuck, was a nineteen-year-old newly crowned monarch facing a question that had troubled development economists for decades. Bhutan was poor by every conventional measure. Its GDP per capita was among the lowest in the world. Its infrastructure was minimal. Its population was mostly subsistence farmers. By the logic of the meter stick, Bhutan needed to industrialize, urbanize, and accumulate capital as quickly as possible.
The King said no.
He had been educated in India and England, had seen what development did to traditional societies, and had concluded that the cost exceeded the benefit. He announced that Bhutan would pursue something else: Gross National Happiness. The phrase sounded utopian, even naive. Western economists dismissed it as a slogan. But the King was serious. He instructed his planners to design a development strategy organized around four pillars: sustainable and equitable socioeconomic development, environmental conservation, cultural preservation, and good governance.
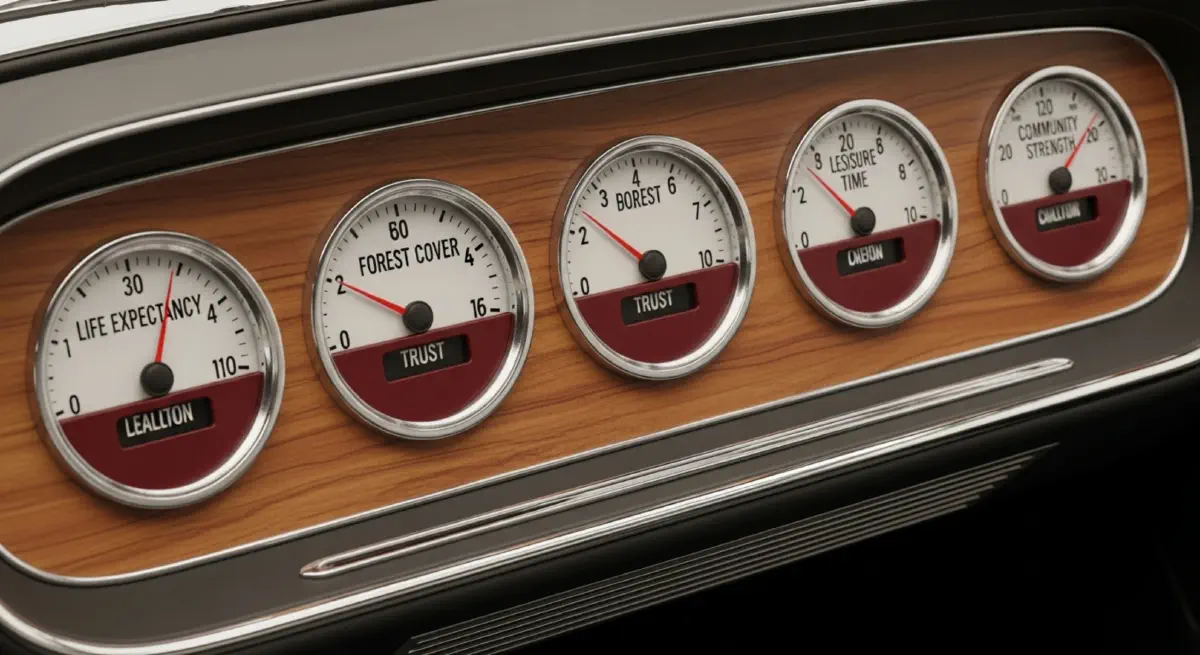
Fifty years later, the numbers tell a story that the meter stick cannot capture. Bhutan’s life expectancy rose from forty-five years in 1980 to seventy-two years in 2020. Literacy climbed from twenty-three percent to seventy percent. Forest cover, mandated by the constitution to remain at sixty percent, actually increased. The country remained poor by GDP standards—roughly thirty-five hundred dollars per capita in 2023. But by human standards, it was outperforming most of the world.
The Bhutanese experiment proved that another meter stick was possible. The question was whether anyone would use it.
The Genuine Progress Indicator#
In 1995, the economists Herman Daly and John Cobb, along with Clifford Cobb, published a paper introducing the Genuine Progress Indicator. GPI started with the same personal consumption data as GDP. Then it made a series of adjustments.
It added the value of household work and volunteer labor, which GDP ignores because no money changes hands. It added the value of higher education, which GDP counts only as spending, not as an investment in human capability. It subtracted for income inequality, because a dollar in a poor household produces more well-being than a dollar in a rich one, and rising inequality means that growth benefits fewer people. It subtracted for the cost of crime, commuting, and family breakdown—all the things that GDP counts as economic activity but that actually represent a response to social failure. It subtracted for resource depletion, pollution, and long-term environmental damage.
When Daly and Cobb ran the numbers for the United States, they found something striking. From 1950 to 1970, GPI rose alongside GDP. Both lines climbed together. But after 1970, they diverged. GDP kept climbing, doubling by 2000. GPI flattened, then began to decline. By the turn of the millennium, the average American was twice as rich by the old measure and poorer by the real one.
The GPI has since been calculated for dozens of countries and regions. The pattern holds almost everywhere. After a certain point, material growth ceases to improve human well-being and begins to degrade it. The salt water glass looks full. The cells remain dehydrated.
The Dashboard Approach#
The economist Joseph Stiglitz, winner of the Nobel Prize in 2001, chaired a commission for the French government in 2008 charged with rethinking how to measure economic performance and social progress. The commission’s report, published in 2009, recommended what it called a “dashboard” approach.
No single number, Stiglitz argued, could capture the complexity of human well-being. Instead, societies should track multiple indicators simultaneously: material living standards, health, education, personal activities including work, political voice and governance, social connections, environmental conditions, and economic and physical security. Each indicator would reveal something different. The dashboard would allow trade-offs to be seen and debated.
The recommendation was elegant and sensible. It was also, in political terms, nearly impossible. A dashboard does not generate headlines. It does not provide a single number that incumbents can boast about or challengers can attack. It does not fit the media cycle or the election cycle or the attention span of voters. GDP, for all its flaws, has one overwhelming advantage: it is one number. One number can be compared, ranked, and simplified. One number fits on a bumper sticker.
The dashboard approach has been adopted by some governments—Canada’s Index of Wellbeing, the United Kingdom’s Measuring National Well-being program, the OECD’s Better Life Index—but none has displaced GDP as the headline metric. The tyranny of the single number remains intact.
The Neuroscience of Enough#
The researcher Paul Dolan, at the London School of Economics, has spent two decades studying happiness and public policy. His 2014 book Happiness by Design synthesizes findings from neuroscience, psychology, and behavioral economics into a practical framework. The key insight is simple: attention is the only resource that matters.
Dolan distinguishes between pleasure and purpose. Pleasure is the experience of positive feelings in the moment. Purpose is the experience of meaning, often involving difficulty, challenge, or sacrifice. Humans need both. A life of pleasure without purpose feels empty. A life of purpose without pleasure feels exhausting. Well-being, Dolan argues, is the product of attention allocated to experiences that provide both.
The implication for measurement is radical. If attention is the scarce resource, then the goal of policy should be to create conditions that allow people to allocate attention to what matters. This is not about GDP. It is not even about GPI. It is about the structure of daily life: the length of commutes, the flexibility of work, the availability of green space, the strength of social networks, the quality of air and water, the security of community.
These are measurable. They are measured, in fact, by epidemiologists, sociologists, and urban planners. They simply are not included in the meter stick. They could be.
The Cost of Getting It Wrong#
In 2020, the Lancet Commission on pollution and health published its findings. Pollution, the report concluded, was responsible for nine million premature deaths per year—one in six of all deaths worldwide. The economic cost, in lost labor and health spending, was estimated at 4.6 trillion dollars annually, about 6.2 percent of global GDP.
The pollution that caused these deaths was, in almost every case, a byproduct of economic activity that GDP counted as growth. The factories, power plants, and vehicles that emitted the toxins were producing goods and services that appeared in national accounts. The deaths did not appear anywhere. They were externalized, pushed outside the accounting framework, made invisible by the meter stick.
The same logic applies to climate change. The Intergovernmental Panel on Climate Change estimates that continuing on the current emissions path will reduce global GDP by between two and twenty percent by 2100, depending on the model. The wide range reflects uncertainty, but the direction is clear: the activity that GDP celebrates today is destroying the conditions that future GDP will depend on. The meter stick is blind to its own destruction.
The Question We Must Answer#
In 1934, Simon Kuznets warned Congress that the welfare of a nation could not be inferred from national income. In 1968, Robert Kennedy warned that GDP measured everything except what made life worthwhile. In 2009, Joseph Stiglitz warned that relying on a single number was leading policy astray.
The warnings have been consistent for ninety years. They have been ignored for ninety years. The question is not whether another meter stick is possible. It is. The question is whether we have the collective will to use it.
The salt water civilization has given us unprecedented material abundance. It has also given us unprecedented loneliness, anxiety, and ecological destruction. We have been drinking for five thousand years, and we are still thirsty. The glass is always full. The cells are always dehydrated.
The alternative is not to stop measuring. It is to measure what matters. It is to build a dashboard that tracks health, connection, purpose, and sustainability alongside output and income. It is to admit that the meter stick we have been using was never designed to capture human flourishing and that continuing to use it is not just foolish but dangerous.
We opened this series in the heat of Giza, watching twenty-seven men die under a fifty-ton block. The pyramid still stands. The workers are dust. The question we have to answer, individually and collectively, is whether we want to keep building pyramids that crush us or whether we are finally ready to build something else.
Something that does not leave us thirsty.