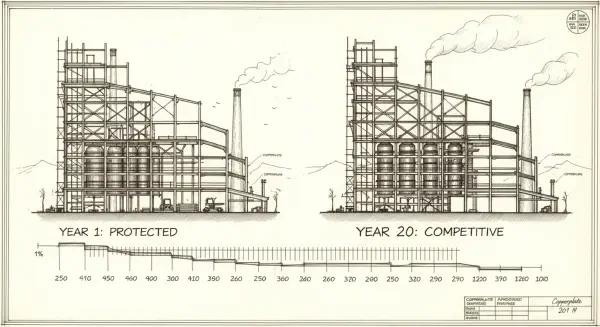
In October 1958, a small Japanese car called the Toyopet made its American debut. It failed immediately. Most buyers thought it looked lousy. Savvy consumers were reluctant to trust a cheap subcompact from a place known only for second-rate goods. The car was pulled from the US market. Many Japanese, including prominent economists, concluded that the country should abandon automobiles and stick to silk. Toyota, they argued, had been given every protection it needed for twenty-five years and had produced nothing worthy of the world market. General Motors and Ford had been excluded for that entire period. The Bank of Japan had bailed out Toyota in 1949 when it faced bankruptcy. Enough was enough.
Had they been right, the Lexus would never have existed.
Key Insights#
- During the 1960s and 1970s, when developing countries used protectionist industrial policies, their per capita income grew at 3.0% annually — double the rate achieved after adopting neo-liberal reforms in the 1980s onward (1.7%).
- South Korea in 1961 had a per capita income of $82, lower than Ghana’s $179; forty years later it was one of the world’s leading exporters of semiconductors and mobile phones — a transformation achieved through state direction, tariff protection, and selective foreign investment controls, not free trade.
- The “official history” of globalization inverts the actual record: Britain and the United States, the chief proponents of free trade, were the most protectionist economies in the world until each achieved industrial supremacy.
- Latin America’s per capita income grew at 3.1% annually during the “bad old days” of import substitution industrialization and at less than one-third that rate after embracing neo-liberal reforms.
- Africa, whose economies were effectively managed by the IMF and World Bank for a quarter century, saw living standards fall in absolute terms during the neo-liberal period.
- The policy prescriptions delivered to developing countries today — trade liberalization, deregulation, privatization — are structurally incompatible with the policies those same countries used to develop.
- Historical amnesia, not deliberate conspiracy, explains most of this contradiction: rich countries have gradually rewritten their own histories to accord with their present self-image as free-market societies.
The growth numbers do not match the story#
In 1961, South Korea had a per capita income of $82 a year — lower than Ghana’s $179. A USAID internal report from the 1950s called Korea a “bottomless pit.” Its main exports were tungsten, fish, and wigs made from human hair. By the early 2000s, Korea was one of the world’s leading exporters of semiconductors, flat-screen televisions, and mobile phones. The country’s per capita income had grown fourteen times in purchasing power terms, a transformation that took Britain more than two centuries and the United States more than a century to replicate.
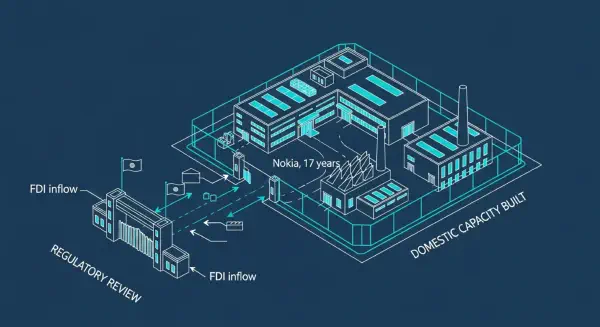
The standard explanation, delivered by neo-liberal economists and repeated in every introductory textbook, is that Korea succeeded because it embraced free markets and free trade. The reality is close to the opposite. The Korean government owned all the banks, directing credit to industries it had selected in consultation with the private sector. It maintained high tariffs and subsidized infant industries through the period of their incubation. It imposed absolute controls on foreign exchange and restricted foreign investment to sectors it approved. It tolerated — and sometimes encouraged — the reverse-engineering of foreign patents. Violation of foreign exchange regulations was punishable by death.
None of this is unusual. It is, in fact, the dominant pattern of successful economic development across the post-war period.
The era labeled as failure was actually the era of fastest growth#
Between 1960 and 1980, the period that the official history of globalization depicts as a disaster of state intervention and protectionism in the developing world, per capita income in developing countries grew at 3.0% annually. This was faster than anything those countries had ever achieved — faster than the growth recorded during the age of imperialism, faster than the growth recorded under British-imposed free trade, and roughly twice the rate achieved after developing countries adopted neo-liberal policies. In Latin America, the supposedly worst offender, per capita income grew at 3.1% per year. Brazil, the most aggressive industrializer, grew almost as fast as the East Asian miracle economies.
After 1980, when neo-liberal policies were implemented across the developing world — pushed by the IMF, the World Bank, and bilateral pressure from the United States — growth in developing countries slowed to 1.7% per year. In Latin America, it fell to less than a third of the previous rate. In Africa, whose economies were effectively managed by the Bretton Woods institutions for a quarter century, living standards declined in absolute terms. The growth collapse is not a detail: it is the central empirical event of the neo-liberal period, and it almost never appears in the accounts written by its promoters.
Figure 1: The horizontal axis shows three regional groupings (developing countries, Latin America, and rich countries) across two policy eras (1960–80 and 1980–2000); the vertical axis shows annual per capita GDP growth as a percentage. The relationship is monotonically negative: every region grew faster during the era of protected industrialization than during the subsequent neo-liberal period, with the sharpest declines in Latin America (from 3.1% to 1.0%) and developing countries overall (from 3.0% to 1.7%). This directly contradicts the central claim of the “official history” that trade liberalization accelerates growth.

The champions of free trade were its most committed opponents#
The deeper irony is historical. Britain, the society that invented the ideology of free trade and pressed it upon the world, was one of the most protectionist economies in the world until the mid-nineteenth century. Under Robert Walpole, the first British prime minister, Parliament deliberately raised tariffs on imported manufactured goods, subsidized exports, and used every available tool to protect infant industries from Dutch and German competition. In 1820, Britain’s average tariff rate on manufactured imports was 45–55%. The Low Countries and Germany, supposedly the protectionist foils, had rates of 6–12%. Britain adopted free trade in 1846, precisely when its industries had become so dominant that protection was no longer necessary and had become actively counterproductive. The country had climbed the ladder; it then kicked it away.
The United States offers an even more striking case. From the 1820s through the First World War, the United States maintained average manufacturing tariffs of 40–50% — the highest of any country in the world. Alexander Hamilton, the first Treasury Secretary, had outlined a comprehensive industrial promotion programme in 1791 that included tariffs, subsidies, export bans on key raw materials, and government investment in infrastructure. Abraham Lincoln, celebrated as the Great Emancipator, was equally the Great Protector, raising industrial tariffs to historic highs during the Civil War and sustaining them for the next half century. The United States became the world’s dominant industrial economy behind those walls, then became the world’s leading advocate of free trade once the walls were no longer needed.
Figure 2: The horizontal axis lists five countries; the vertical axis shows average manufacturing tariff rates at their peak protectionist period. The relationship is counter-intuitive and therefore analytically significant: Britain and the United States, the countries that subsequently championed free trade most forcefully, had the highest manufacturing tariffs (50% and 44% respectively) precisely during the periods of their fastest industrial development. Germany and the Netherlands, often characterized as protectionist foils to free-trade Britain, maintained rates that were a fraction of British and American levels. The pattern directly supports Chang’s “kicking away the ladder” thesis.

The rewriting happens slowly and without intent#
Ha-Joon Chang, the Cambridge economist who reconstructed this history, is careful about the mechanism. He does not argue for a sinister committee that deliberately falsifies the record. History, he notes, is written by the victors, and it is human nature to reinterpret the past in light of the present. Rich countries have gradually and often unconsciously rewritten their own histories to accord with their present self-image as free-market societies. The British remember free trade but not the century of industrial protection that preceded it. Americans celebrate entrepreneurship but have forgotten Hamilton. The result is that the Bad Samaritans — Chang’s term for the rich country governments and institutions that press free-trade orthodoxy on poor countries — often do so in the honest but mistaken belief that they are recommending the policies that made their own ancestors rich. The sincerity makes the damage no smaller.
What the data actually show#
When developing countries pursued “wrong” policies of protectionism and state intervention in the 1960s and 1970s, they grew at 3.0% per capita per year — a figure that the late Ajit Singh of Cambridge called “the Industrial Revolution in the Third World.” When they adopted neo-liberal policies, they grew at 1.7%. The excluded cases tell the same story. China and India, which grew fastest during the neo-liberal period, did so precisely because they refused to adopt neo-liberal policies in full: China maintained average tariffs above 30% through the 1990s and imposed strict controls on foreign investment; India liberalized trade but kept average manufacturing tariffs above 30% and severely restricted foreign direct investment. The two countries that account for the most spectacular poverty reduction in human history are the two that most consistently ignored the prescriptions of the Washington Consensus.
Conclusion#
When the map does not match the territory, the appropriate response is to revise the map. The official history of globalization is a map drawn to justify the destination rather than to describe the route.