
From British India’s Home Charges to the Pentagon’s Iran campaign: the same mechanism, different letterhead — the public foots the bill, the contractors book the revenue.
In the financial year 1904–05, the British Government of India transferred £19,463,757 (~$4 Billion USD in today’s money) to London in a single annual payment cycle. The money came from land taxes paid by approximately 250 million farmers — most earning less than £2 per year. It flowed to India Office bondholders in the City of London, to retired army officers drawing pensions in English country houses, and to Whitehall departments whose purpose was to administer the collection of the same funds that paid their salaries. The accounts were published in full. Parliament discussed them on at least three consecutive nights in June 1879. Nothing changed.
On October 19, 2023, the Pentagon submitted its sixth consecutive failed audit. The Department of Defense — renamed the Department of War (DoW) by executive order on September 5, 2025 — oversees approximately $3.8 trillion in assets. According to a Reuters investigation published in November 2019, drawing on Defense Finance and Accounting Service records, the DoD has recorded $35 trillion in internal accounting adjustments over a multi-year period — not the deficit, but bookkeeping corrections required because its financial systems cannot produce a reconciled ledger. In the same fiscal year, the top five defense contractors collectively received approximately $154 billion in federal contracts. Lockheed Martin alone received $62.2 billion — more than the entire State Department budget, more than the GDP of 80 countries.
These two paragraphs describe the same system.
The uniform has changed. The operating logic has not.
The Architecture Britain Constructed#
Before drawing the parallel to American power, it is worth being precise about what the British imperial system was — and was not. It was not simply theft. It was something more durable: a fiscal architecture that transferred costs to one population while concentrating returns in another, maintained by institutional complexity that prevented both populations from ever seeing the gap in a single document.
The most rigorous quantitative study of British imperial finance ever produced — Lance Davis and Robert Huttenback’s Mammon and the Pursuit of Empire (Cambridge University Press, 1986) — spent a decade constructing a database of 482 imperial companies and 316 domestic companies between 1860 and 1912. Their finding was unequivocal: imperial companies, on average, produced lower returns than domestic British ones. Empire was not profitable for Britain in aggregate. It was profitable for a specific class within Britain.
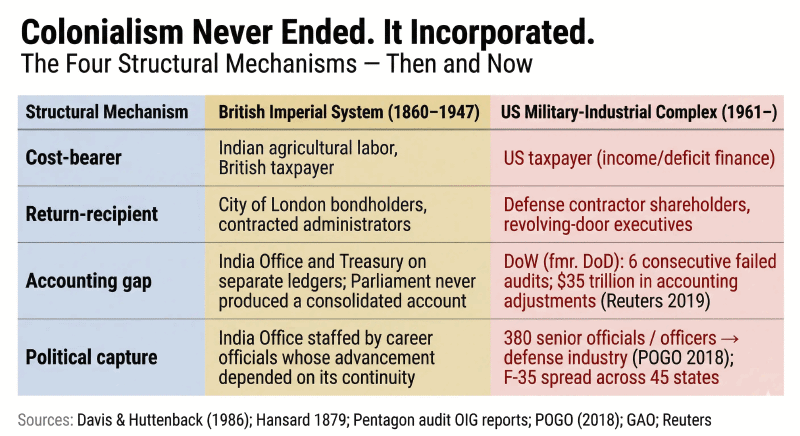
The mechanism had four components:
- Costs socialized across a broad population — Indian agricultural laborers, British middle-class taxpayers
- Gains concentrated in a narrow connected class — India Office bondholders, contracted administrators, retired officers
- The two ledgers kept permanently separate so the transfer was never visible in a single accounting document
- No political mechanism capable of forcing consolidation
Gladstone identified the problem from the floor of the House of Commons on June 12, 1879. India’s accumulated fiscal deficit over seven years had reached £34.5 million. The Home Charges — annual transfers covering London-held debt interest, military pensions for officers retired to England, and India Office administrative costs — had grown 122% in eleven years, from 84.97 million rupees in 1868 to 189 million rupees in 1879, now consuming the full equivalent of India’s net land revenue. Every rupee an Indian farmer paid as land tax was, in effect, being remitted to London before any Indian public expenditure could draw on it.
Gladstone called it “a tremendous contingency.” He asked for radical retrenchment. He asked for an honest accounting. Parliament agreed with him, passed a procedural resolution, and adjourned.
The American system did not copy this structure. It reinvented it independently, as all extractive systems do, along the same logical lines.
The American Reproduction: Three Mechanisms#
The US military-industrial complex reproduces the British four-part structure with three modifications: the colonized population has been partially internalized (the American taxpayer now plays the role India played); extraction operates through IP ownership and contract capture rather than currency manipulation; and the accounting gap is maintained not by jurisdictional separation but by institutional complexity and deliberate audit resistance.
Three documented mechanisms make this concrete.
Mechanism One: Socialized R&D, Privatized IP#
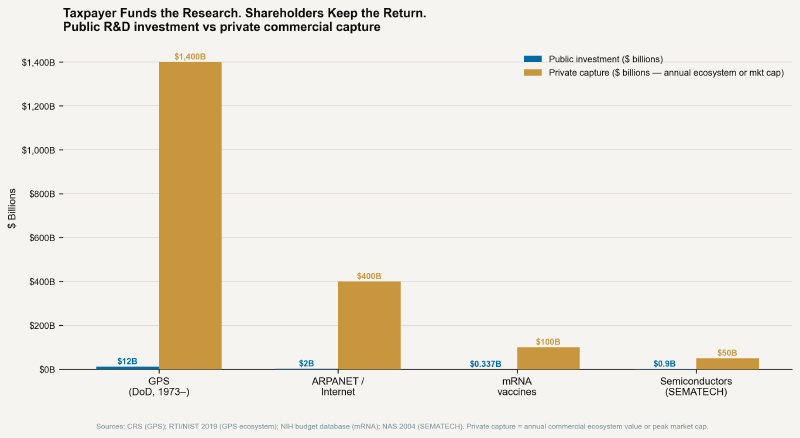
The British taxpayer funded the Royal Navy, which reduced the political risk premium on imperial investment, guaranteeing the returns of bondholders who never set foot in India. The American taxpayer funds basic and applied research through DARPA, NIH, DOE, and NSF. The private sector receives those outputs — at no cost, with no equity returned to the public — and commercializes them at scale.
The internet was ARPANET, funded entirely by DARPA beginning in 1969 at a cost measured in the hundreds of millions. The commercial ISP ecosystem it spawned in the 1990s produced hundreds of billions in private profit. The public received no equity stake, no licensing revenue, no return proportional to its investment.
GPS was developed by the US Department of Defense beginning in 1973. Total government development cost: approximately $12 billion (Congressional Research Service). The commercial GPS ecosystem now generates over $1.4 trillion annually — that figure is from a 2019 study commissioned by the National Institute of Standards and Technology and conducted by RTI International. The public, which paid for GPS, holds no claim on that $1.4 trillion.
mRNA vaccine technology: NIH funding for foundational mRNA research exceeded $337 million between 1985 and 2020, per NIH’s own budget database. Moderna, which commercialized this publicly-funded research, reached a market capitalization exceeding $100 billion during the COVID-19 pandemic. When NIH disputed patent rights, it lost — in a 2022 Patent Trial and Appeal Board ruling that awarded the patents to Moderna. The investment was public. The return was private. The legal system confirmed the distribution.
Semiconductors: The SEMATECH consortium (1987), funded by DARPA at $100 million per year, stabilized the American semiconductor industry when Japanese competition threatened it. The firms that benefited — Intel, Texas Instruments, AMD, Motorola — were private shareholders. The public received no equity stake in the industries its capital rescued.
Economist Mariana Mazzucato’s The Entrepreneurial State (Anthem Press, 2013) is the most systematic documentation of this pattern: Siri, touchscreen technology, and lithium-ion batteries were all developed with federal research grants and commercialized by private firms — most prominently Apple — with no public return.
The structural point is identical to the British Home Charges: the cost-bearer (taxpayer) and the return-recipient (shareholder) are different populations, and no consolidated public document makes the transfer visible in a single ledger.
Mechanism Two: Federal Wars, Contractor Revenue#
Britain fought its imperial wars with the Indian Army, funded from the Indian treasury — a colonial population paying for the military operations that maintained its own subjugation. The American version is structurally parallel: the federal military (funded by taxpayers) fights the wars; private contractors capture the return through logistics contracts, weapons procurement, and reconstruction deals.
The documented figures are as follows.
Iraq and Afghanistan combined (2001–2021): Total federal expenditure estimated at $6.4–8 trillion — this is the Brown University Costs of War Project’s 2023 update, which includes long-term veteran care and interest on war borrowing. The Commission on Wartime Contracting in Iraq and Afghanistan (2011), a bipartisan United States congressional commission, found that $31–60 billion was wasted through fraud, waste, and abuse in a contracting environment that disbursed approximately $900 billion to private firms.
Halliburton/KBR: Received $39.5 billion in federal contracts in Iraq, including a no-bid LOGCAP logistics contract. Dick Cheney served as Halliburton’s Chief Executive from 1995 to 2000, before becoming Vice President of the United States. The contracting decision structure was not illegal. Its architecture — former senior official, private firm, federal contract — is not an exception to the system. It is the system operating as designed.
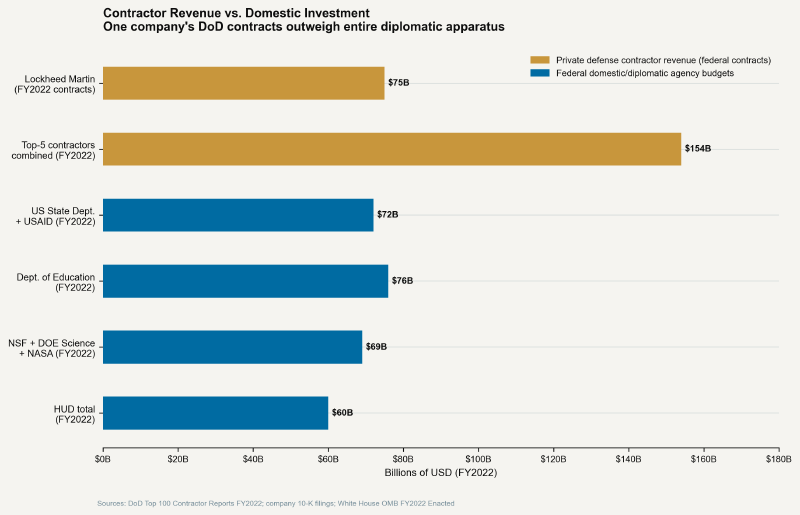
Lockheed Martin: Received $75 billion in federal contracts in fiscal year 2022 (Bloomberg; company 10-K filing). In the same year, the US State Department’s total budget was approximately $58 billion. The largest defense contractor in the world, a publicly traded company whose shareholders include major institutional investors, received more public money in a single year than the entire American diplomatic apparatus.
Top five defense contractors (Lockheed Martin, Raytheon Technologies, Boeing Defense, General Dynamics, Northrop Grumman): Collectively received approximately $98–177 billion per year in federal contracts between 2015 and 2022, rising monotonically across that period except for the RTX formation year.
The war is an expense column in the federal budget. The same activity is a revenue column in a private income statement. No single document holds both simultaneously.
Mechanism Three: The Accounting Gap and the Revolving Door#
The British imperial system sustained itself for the same reason it sustained the Home Charges for 70 years after Gladstone’s warning: no consolidated accounting document was ever produced that placed Indian costs and British investor gains in a single ledger. The administrative structure was specifically designed to prevent this ledger from being constructed.
The American equivalent operates through two interlocking structures.
The Pentagon audit failure: In 2018, the Department of Defense conducted its first-ever full financial audit — 227 years after the department’s founding. It failed. It has failed every audit since. As of 2024, the DoD (now DoW) has never passed a clean financial audit under any administration. Reuters’ November 2019 investigation, based on Defense Finance and Accounting Service records, identified $35 trillion in internal accounting adjustments over a multi-year period. No consolidated accounting of military-industrial costs and public return has ever been produced, because the institutional infrastructure for producing such an account does not exist and no administration of either party has built it.
A pointed footnote: in January 2026, the Congressional Budget Office was asked to estimate the cost of implementing Executive Order 14347 — the order that authorized “Department of War” as a secondary title. CBO found that a modest implementation would cost approximately $10 million; a broad, rapid rollout could reach $125 million; and a full statutory renaming through Congress could cost hundreds of millions of dollars (CBO, The Costs of Using the Name “Department of War,” January 14, 2026). The department that cannot pass a financial audit of its $3.8 trillion in assets has budgeted between $10 million and $125 million to change its letterhead. The accounting systems remain unbuilt. The signage budget has been approved.
The revolving door as institution: A 2018 report by the Project on Government Oversight (POGO) identified 380 senior government officials and high-ranking military officers who moved to defense industry positions within two years of leaving government service. They carry security clearances, personal relationships with procurement decision-makers, and knowledge of classified program requirements. Their private employers — Lockheed, Raytheon, Boeing, General Dynamics, Northrop — pay for access to the federal procurement process. This is not individual corruption. It is the system’s designed architecture.
Dwight D. Eisenhower named this structure in his January 17, 1961 Farewell Address — not as a moral concern but as a structural one: “In the councils of government, we must guard against the acquisition of unwarranted influence, whether sought or unsought, by the military-industrial complex. The potential for the disastrous rise of misplaced power exists and will persist.”
The institutional arrangement he warned against has since grown by every measurable dimension. The five companies he could not have named in 1961 now receive more annually in Pentagon contracts than the entire US State Department, USAID, and intelligence community combined.
Live Case Study: The Iran War, April 2026#
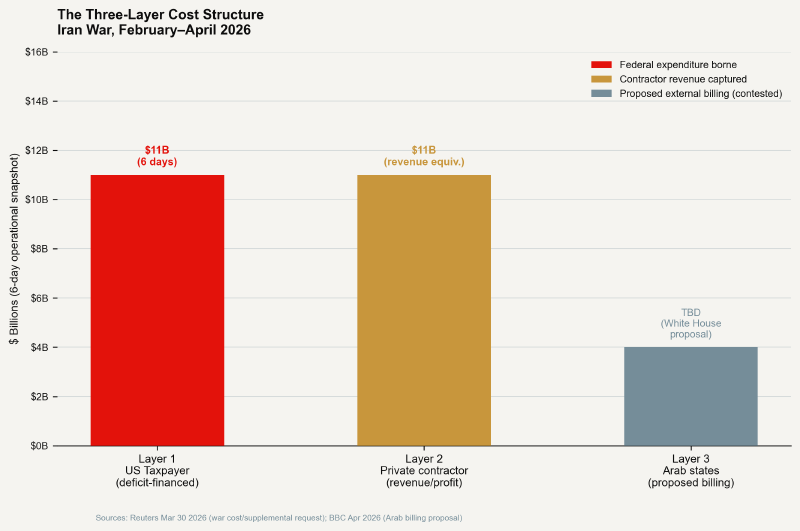
On April 1, 2026, the Iran war enters its 32nd day. In the first six days of operations alone, the cost exceeded $11 billion — by the White House’s own account to lawmakers, as reported by Reuters on March 30, 2026. The administration has requested $200 billion in supplemental military funding, which has encountered resistance even from a Republican-controlled Congress that had already approved an $840 billion FY2026 Defense Appropriations Act and $156 billion in defense spending through last summer’s tax-cut legislation.
The contractor revenue from these operations is not yet fully in public reporting — but it follows mechanically from the supply chain structure. Lockheed Martin, Raytheon, Boeing, and General Dynamics supply the munitions being expended against Iranian infrastructure. Each strike cycle replenishes a supply chain whose resupply contracts flow directly to those balance sheets. The war’s expense column in the federal budget is their revenue column.
The Iran war has additionally introduced a third layer of cost externalization that the British system attempted only partially: the White House has proposed that Arab states — most of which publicly opposed the war’s initiation and called for diplomacy — should fund it retroactively. The BBC has reported that the Gulf War precedent is being invoked: coalition members including Germany, Japan, and Gulf states raised the equivalent of $134 billion (2025 dollars) during the 1990–1991 Gulf War. But the structural conditions are not analogous. The 1991 coalition was assembled to respond to an Iraqi invasion of Kuwait; coalition members had formally requested US intervention. The 2026 Arab states requested the opposite. They are being asked to fund a war they opposed, justified as being in their long-term security interest — a definition provided by the billing party.
The British government billed India for wars fought on Indian territory, administered through Indian military labor, and justified as India’s security interest. The White House’s framing — “short-term actions and short-term price fluctuations for the long-term benefit of ending the threat that Iran poses” — performs the same rhetorical function. The intervening power defines the security interest of the billed party, then presents the bill as a service charge.
The three layers of cost socialization now operating simultaneously:
Layer 1 — The American taxpayer: The $200 billion supplemental request, if passed, is deficit-financed — a deferred tax on future Americans, not a current extraction from living voters. They bear the cost without seeing the bill arrive.
Layer 2 — Private defense contractors: Lockheed Martin, Raytheon, Boeing, and General Dynamics supply the munitions being expended. The war’s expense column in the federal budget is their revenue column. No single document shows both simultaneously.
Layer 3 — Third-party states: Arab governments that opposed the war are being asked to fund it. The coercion mechanism is implicit: states that depend on US security guarantees cannot refuse without signaling strategic unreliability. The British billed India for wars India neither requested nor voted for. The structure is not a historical metaphor. It is a live policy instrument.
An $11 billion six-day operation. Zero cost to Raytheon. Bounded but real advantage to Raytheon shareholders.
The People the Ledger Doesn’t Count#
The British Imperial Balance Sheet, assembled in its own primary sources, shows clearly who bore the costs: the Indian agricultural laborer paying a land tax that funded the pension of a retired British officer he would never meet, in a country he would never visit, in a currency whose value he could not influence. The Colonial Office wage tables from Basutoland in 1931 show native administrators earning £24 per year — well below the minimum wage floor of the most junior European staff at £200 — not because their work was less skilled or less productive, but because the administrative salary scales said so. The wage differential was not a market outcome. It was an administered extraction.
The American ledger has its own populations who do not appear in the defense contractor revenue statements.
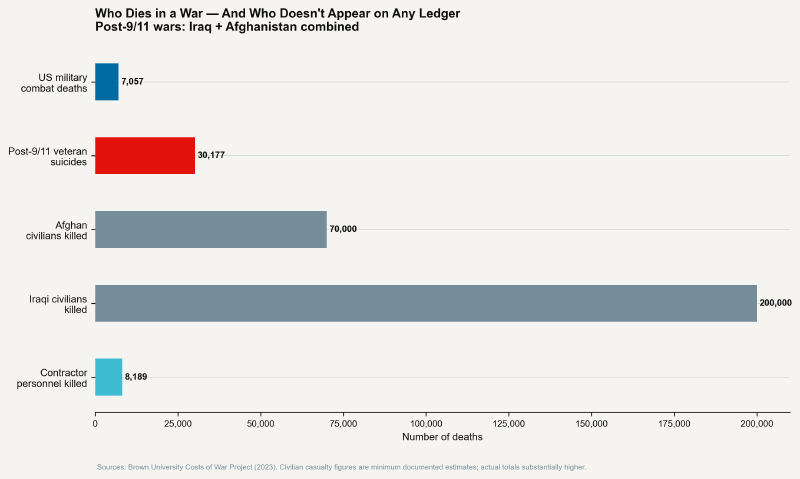
American soldiers: 4,431 killed in Iraq. 2,461 killed in Afghanistan. 7,057 direct combat deaths in all post-9/11 wars combined (Brown University Costs of War Project, 2023). Against that number: approximately 30,177 post-9/11 veterans have died by suicide — more than four times the combat death toll. These deaths are real. They appear in the Veterans Affairs budget as “healthcare costs.” They do not appear in Lockheed Martin’s income statement as costs.
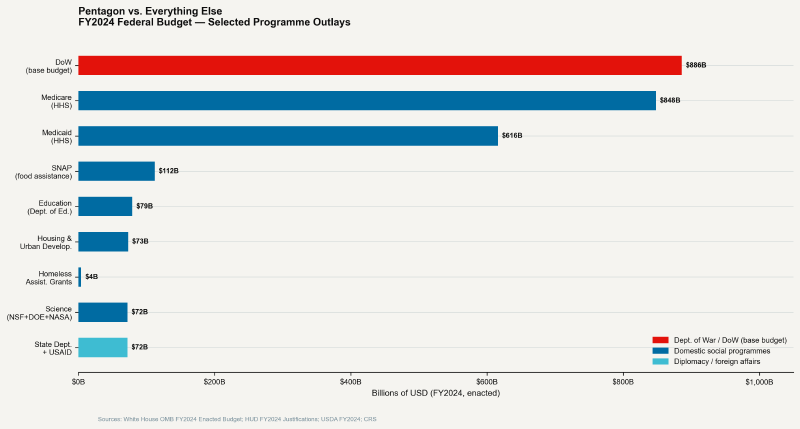
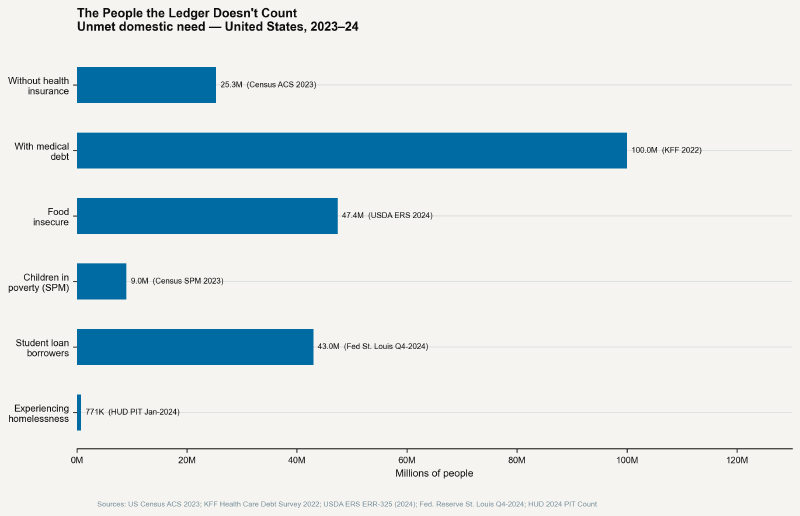
The American homeless: In January 2024, HUD’s Point-in-Time count recorded 771,480 people experiencing homelessness in the United States — a record high since counting began. Reuters reported this figure in December 2024. Of those, 35,574 were veterans (HUD 2023 AHAR). In the same fiscal year, the DoD budget exceeded $886 billion. The total federal Homeless Assistance Grants program allocated approximately $4 billion. The United States spends more on its military every 40 hours than the federal government spends on homelessness in an entire year. This is a policy choice, not a constraint.
The American hungry: In 2023, 13.5 percent of all US households — approximately 47.4 million people — were food insecure, meaning they lacked consistent access to enough food for an active, healthy life (USDA Economic Research Service, Household Food Security in the United States in 2023, ERS Report ERR-325, September 2024). Among those, 18.2 million people lived in households with very low food security — a clinical condition in which some members went without meals at times. The total federal SNAP budget in FY2024 was $112 billion, serving approximately 42 million Americans. The FY2024 DoD base budget was $886 billion — nearly eight times total SNAP expenditure. Food insecurity is a solved problem: the science of nutrition, the logistics of distribution, and the agricultural capacity all exist. The choice not to eliminate it is fiscal, not technical.
The American uninsured and medically indebted: As of 2023, approximately 25.3 million Americans under 65 had no health insurance coverage (US Census Bureau, 2023 American Community Survey). At the same time, a KFF Health Care Debt Survey (2022) found that 41 percent of US adults — an estimated 100 million people — carried debt from medical or dental bills. Medical debt is the leading cause of personal bankruptcy in the United States. The mRNA vaccine platform whose foundational research NIH funded for $337 million is now a commercial product whose manufacturer, Moderna, maintains a market capitalization in the tens of billions. The public that funded the research pays market price for the product.
The American student indebted: Total outstanding federal student loan debt reached approximately $1.74 trillion as of the fourth quarter of 2024 (Federal Reserve Bank of St. Louis), held by roughly 43 million borrowers. This sum exceeds the GDP of Australia. It was accumulated primarily by people pursuing the education that the American labor market requires for entry-level professional employment — a market whose requirements have risen consistently while its wage floor, adjusted for inflation, has been flat for decades. It does not appear anywhere in Lockheed Martin’s consolidated balance sheet.
The American child in poverty: The US Census Bureau’s 2023 Supplemental Poverty Measure found that 12.9 percent of American children — approximately 9 million children — lived below the poverty line. The expanded Child Tax Credit introduced in 2021 reduced child poverty to a record low of 5.2 percent in that year; its expiration returned child poverty rates to prior levels within twelve months. The fiscal cost of maintaining the expanded CTC permanently was estimated at approximately $120 billion per year (Congressional Budget Office). The FY2026 Defense Appropriations Act allocated $840 billion. The choice between these two fiscal positions was made explicitly and repeatedly.
The global health population — USAID’s 92 million: USAID was the world’s largest bilateral aid agency. Founded in 1961, it employed 10,000 people globally and administered programs that — according to a 2025 Lancet analysis — saved 92 million lives over two decades through HIV treatment, tuberculosis control, malaria prevention, polio vaccination, and nutrition support. PEPFAR, the President’s Emergency Plan for AIDS Relief, launched by George W. Bush in 2003, was alone credited with saving 25 million lives. The agency was systematically dismantled beginning in early 2025 and officially closed on July 2, 2025, with its remaining programs absorbed by the State Department. By November 2025, Atul Gawande — surgeon, author, and former USAID assistant administrator for global health — cited a model by Boston University epidemiologist Brooke Nichols estimating that the shutdown had already caused the deaths of 600,000 people, two-thirds of them children (Gawande, The New Yorker, November 5, 2025; Harvard T.H. Chan School of Public Health, November 20, 2025). Lancet researchers projected up to 14 million additional deaths by 2030, one-third of them children (BBC, July 2, 2025). These deaths are not attributable to combat. They do not appear in any military ledger — not in the Iran war casualty count, not in defense contractor income statements, not in the federal supplemental request. They are deaths caused by a budget reallocation. PEPFAR costs approximately $6–7 billion per year in federal appropriations. The first six days of the Iran war cost $11 billion. The arithmetic does not require further commentary.
Iranian civilians: BBC and Reuters reporting from March and April 2026 has documented civilian casualties from strikes on Iranian energy infrastructure. The people whose electricity grid was struck, whose hospitals ran on emergency generators, whose children were in schools built next to targeted facilities — they do not appear in any American balance sheet at all. They are the category the British system called “the colonial population”: the group that bears costs that the cost-accounting framework is not designed to capture.
The Arithmetic of the Alternative#
The numbers above describe populations. The numbers below describe policies. The gap between them is the ledger that neither the DoW’s financial systems nor any congressional budget resolution has ever been required to produce.
$11 billion — the White House’s own cost figure for the first six days of the Iran war (Reuters, March 30, 2026).
- = 2.75 years of the entire federal Homeless Assistance Grants budget
- = the cost of permanently expanding Head Start to serve every eligible child on the waiting list (HHS estimates, approximately $10 billion annually)
- = more than the entire annual USDA budget for all international food aid programs combined
the annual cost of PEPFAR (~$6–7B/year) — the program credited with saving 25 million lives from AIDS, funded for less than what the Iran war costs every six days
 *Figure 8 — The White House's own $11B six-day war cost against comparable domestic programme investments. Dollar-for-dollar comparisons using enacted FY2024 budget figures.*
$75 billion — Lockheed Martin’s federal contract revenue in FY2022 (company 10-K; Bloomberg).
entire US State Department and USAID budget combined (~$72 billion in FY2022)
- ≈ 67% of annual SNAP expenditure serving 42 million food-insecure Americans
- ≈ the estimated annual cost of providing universal pre-K for all 3- and 4-year-olds in the United States (Center on Budget and Policy Priorities, 2023)
$154 billion — top five defense contractors’ combined federal contracts in FY2022 (Pentagon Top 100 Contractor Reports).
combined federal spending on education ($79 billion), housing ($73 billion), and science and energy ($46 billion) in the same year
the total federal investment in scientific research (NSF, NIH, DOE, NASA combined) for any year in American history
$1.7 trillion — the F-35 program’s estimated lifetime cost (Government Accountability Office, GAO-23-106717, 2023).
- ≈ a decade of fully funding the expanded Child Tax Credit at the level that cut child poverty to 5.2% in 2021
- ≈ 68 years of the entire NASA budget at current funding levels (~$25 billion/year)
total cumulative US federal student loan portfolio ($1.74 trillion) — the debt that 43 million Americans carry from pursuing the education the labor market requires
 *Figure 9 — The F-35 program's GAO-estimated $1.7T lifetime cost expressed as decades of Child Tax Credit expansion, NASA budgets, and the entire federal student loan portfolio.*
$6.4–8 trillion — total cost of the post-9/11 wars (Brown University Costs of War Project, 2023).
- At the median estimate of $7.2 trillion, this sum — spent over 20 years — would have:
- Eliminated medical debt for all 100 million Americans carrying it, with $7 trillion to spare
- Provided every food-insecure American with SNAP benefits for approximately 64 years
- Built permanent supportive housing for every homeless American, at $150,000 per unit, 5 times over
- Funded the entire US public education system — all K-12 spending — for 13 years
This is not a claim that military spending and social spending are simple substitutes. Defense priorities are real. The comparison is structural: these are the opportunity costs that the federal budget produces but is not designed to display. The Indian farmer in 1879 could not read the Home Charges schedule in Hansard; no consolidated document placed his land tax payment beside the London bondholder’s dividend. The American taxpayer in 2026 cannot navigate the $35 trillion in DoW accounting adjustments; no consolidated document places the defense contractor’s revenue alongside the number of children eating less than one meal a day.
The gap is the system. The system is performing as designed.
The system does not require anyone to intend these outcomes. It produces them structurally. This is Davis and Huttenback’s qualification restated for 2026: bad business for the nation, good business for certain classes. Not a rhetorical flourish. A structural description of a documented fiscal mechanism.
The Falsifiable Claims#
An honest analytical framework must specify what would disprove it. Here is what the evidence would need to show for this framework to be wrong:
Claim 1 — Socialized R&D, privatized IP: Federal R&D spending should correlate with subsequent private-sector market dominance in funded sectors, and the public should hold no proportional return. Observation: Yes — internet (Netscape, Google, Amazon, Meta all built on DARPA-funded infrastructure), GPS ($1.4 trillion annual ecosystem), mRNA vaccines (NIH-funded, Moderna-captured), semiconductors (SEMATECH → Intel), Siri/touchscreen/lithium-ion (federal grants → Apple). In none of these cases does the public receive equity, royalties, or below-market access. This claim is currently unfalsified.
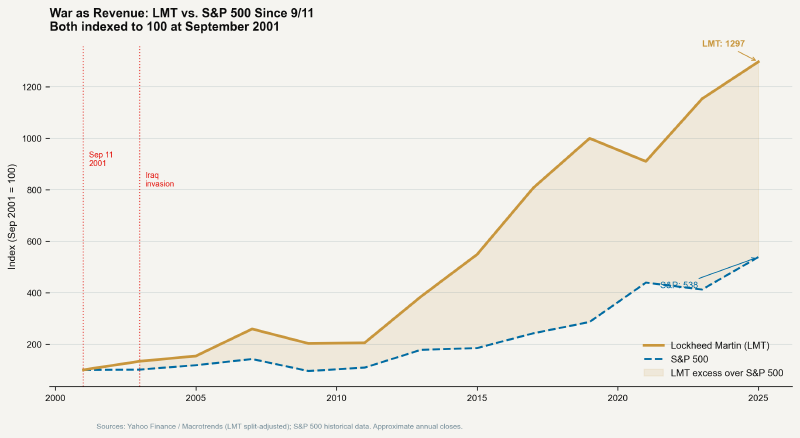
Claim 2 — War as revenue cycle: Defense contractor profits should strengthen during periods of peak military expenditure. Observation: Lockheed Martin’s stock rose from approximately $40/share in September 2001 to over $310/share by 2011 — a gain of more than 670% over the Iraq/Afghanistan period. The S&P 500 returned approximately 0% over the same period (encompassing the dotcom recession and the 2008 financial crisis). Since 2001, LMT has returned over 1,000%. The defense sector’s outperformance during war is documented. This claim is currently unfalsified.
Claim 3 — Contract geography as political architecture: Defense procurement decisions should correlate with contractor employment in congressional districts more than with independent strategic assessment. Observation: The F-35 program deliberately spread its supplier base across 45 US states — a procurement design that makes congressional opposition structurally impossible regardless of per-unit cost. The GAO (GAO-20-339) has identified the F-35 program as one of the most persistently over-budget major acquisitions in DoW history; congressional oversight has not resulted in program termination or restructuring. This claim is currently unfalsified.
Claim 4 — Audit failure is institutional, not political: Pentagon audit failure should persist across administrations. Observation: The DoD has failed its annual audit under Trump (2018, 2019, 2020) and Biden (2021, 2022, 2023) administrations. The dysfunction is institutional. This claim is currently unfalsified.
What would falsify this framework: Evidence that the public captures a proportional return on federally-funded R&D (through equity, patent licensing revenue, or legislated below-market pricing); evidence that defense procurement is systematically optimized against independent cost-benefit analysis rather than against contractor lobbying and congressional district employment; or evidence that the revolving door has no statistically significant effect on contract allocation. None of these conditions currently obtains.
The Structural Verdict#
Gladstone asked in 1879 for “adequate and effectual remedies.” He was correct about the problem and wrong about its solvability from within the system that produced it. The India Office was staffed by the same men whose careers depended on its continuity. The Parliamentary committee that reviewed the Home Charges included men whose social networks overlapped with the bondholders. The reform process was effectively captured by the class whose interests it was meant to constrain.
Eisenhower was also right, and also ineffective. He warned against the military-industrial complex from the Office of the President of the United States, in his Farewell Address, with the full authority of a Supreme Allied Commander. The industry he warned against has since grown by every measurable dimension. The 380 revolving-door officials identified by POGO in 2018 are simply the auditable portion of a network whose depth and continuity is structural.
The $35 trillion in DoW accounting adjustments does not appear regularly in news broadcasts. The $75 billion Lockheed Martin received in a single year is reported in trade publications, briefly. The $11 billion spent in six days on a war that Arab states opposed and Iranians are dying in is discussed in the context of the congressional supplemental request, analyzed for its political implications, and then displaced by the next news cycle.
No single document holds all of these numbers simultaneously. That is not an accident.
The Indian farmer who paid land tax in 1905 could not read the Home Charges schedule in Hansard, even if its numbers were accurate and published. The American taxpayer who paid income tax in 2024 cannot navigate the $35 trillion in DoW accounting adjustments, because the financial systems that would be required to produce a legible document do not exist and have not been built by any administration.
The gap between cost-bearer and benefit-recipient is maintained, in both cases, by institutional complexity that is expensive and difficult to penetrate, and which the beneficiary class has every structural incentive to preserve.
Colonialism did not end in 1947 when India was partitioned. It evolved past the point where it needed to cross an ocean.
The Indian farmer who paid for a British officer’s pension in Bath has a contemporary: the American factory worker in Ohio whose tax dollars fund a Raytheon contract in Tucson whose profits flow to a BlackRock fund whose major clients are institutional investors. And an Iranian family whose power went out in Tehran. And a soldier from Alabama who came home without a leg. And a veteran sleeping under a bridge in Los Angeles.
They are all paying for the same system. The system is not paying them back.
About the Data#
All figures cited above are drawn from the following sources:
| Claim | Source |
|---|---|
| Home Charges £19,463,757 (1904–05) | East India Revenue Accounts, presented to the House of Commons, February 19, 1906 |
| Davis & Huttenback — imperial returns vs domestic | Davis, L. & Huttenback, R. (1986). Mammon and the Pursuit of Empire. Cambridge University Press |
| Gladstone — June 12, 1879 | Hansard, House of Commons, 3rd series, vol. 247 |
| Pentagon audit failures (2018–2024) | DoD Office of Inspector General; Reuters, November 19, 2019 |
| DoD $35 trillion accounting adjustments | Reuters (Mark Skidmore analysis), November 19, 2019 |
| Top 5 contractor contracts | Pentagon FY Top 100 Contractor Reports; company 10-K filings |
| Lockheed Martin $75B (FY2022) | Bloomberg; Lockheed Martin 2022 Annual Report |
| Iraq/Afghanistan $6.4–8 trillion | Brown University Costs of War Project (2023 update) |
| Wartime contracting waste $31–60B | Commission on Wartime Contracting (2011) |
| Halliburton $39.5B Iraq contracts | US Senate Democratic Policy Committee (2004–2006 reports); Reuters |
| GPS ecosystem $1.4 trillion annually | RTI International (2019) for NIST |
| NIH mRNA research $337 million | NIH budget database; Reuters (2020) |
| Moderna patent dispute | Patent Trial and Appeal Board ruling, 2022; Reuters |
| SEMATECH/DARPA $100M/year | National Academy of Sciences (2004) |
| Mazzucato — federal R&D to private IP | Mazzucato, M. (2013). The Entrepreneurial State. Anthem Press |
| 30,177 veteran suicides | Brown University Costs of War Project (2023) |
| 771,480 homeless (Jan 2024) | HUD 2024 Annual Homeless Assessment Report; Reuters, December 2024 |
| 35,574 veterans homeless | HUD 2023 Annual Homeless Assessment Report |
| Federal Homeless Assistance Grants ~$4B/year | HUD FY2024 Budget Justifications |
| 47.4M food insecure Americans (2023) | Coleman-Jensen et al., USDA ERS Report ERR-325, September 2024 |
| 25.3M uninsured Americans | US Census Bureau, 2023 American Community Survey |
| 100M Americans with medical debt | KFF Health Care Debt Survey, 2022 |
| $1.74 trillion student debt | Federal Reserve Bank of St. Louis, Q4 2024 |
| 9M children in poverty (SPM, 2023) | US Census Bureau, 2023 Supplemental Poverty Measure |
| F-35 $1.7T lifetime cost | GAO, GAO-23-106717 (2023) |
| CTC cost estimate ~$120B/year | Congressional Budget Office (2021) |
| Iran war $11B in 6 days | Reuters, March 30, 2026 |
| Iran war cost request $200B | Reuters, March 30, 2026; BBC, April 2026 |
| USAID officially closed July 2, 2025 | BBC, July 2, 2025 |
| USAID shutdown 600,000 deaths (as of Nov 2025) | Brooke Nichols (BU) model, cited in Atul Gawande, The New Yorker, November 5, 2025; Harvard T.H. Chan School of Public Health, November 20, 2025 |
| 14 million projected deaths by 2030 (Lancet) | Lancet (2025) researchers, cited: BBC, July 2, 2025 |
| USAID saved 92 million lives over 20 years | Lancet analysis, PIIS0140-6736(25)01186-9 (2025), cited by Gawande |
| PEPFAR saved 25 million lives | George W. Bush statement, July 2, 2025 (BBC); PEPFAR.gov program record |
| DoW rename cost $10M–$125M (modest–broad); hundreds of millions if statutory | CBO, The Costs of Using the Name “Department of War,” Publication 61942, January 14, 2026 |
| 380 revolving-door officials | Project on Government Oversight (POGO), 2018 |
| F-35 supplier spread across 45 states | GAO-20-339; Reuters |
| LMT stock performance | Yahoo Finance (adjusted closing prices) |
| Eisenhower Farewell Address | January 17, 1961 (Public Papers of the Presidents) |
Note on source selection: Wherever possible, figures are drawn from US government documents (GAO, CBO, OMB, DoD IG), Reuters, BBC, Bloomberg, the Wall Street Journal, or peer-reviewed academic sources. The structural argument does not depend on contested estimates; all core claims are independently verifiable from the primary record.