The Programme That Was Too Popular to Scrutinise#
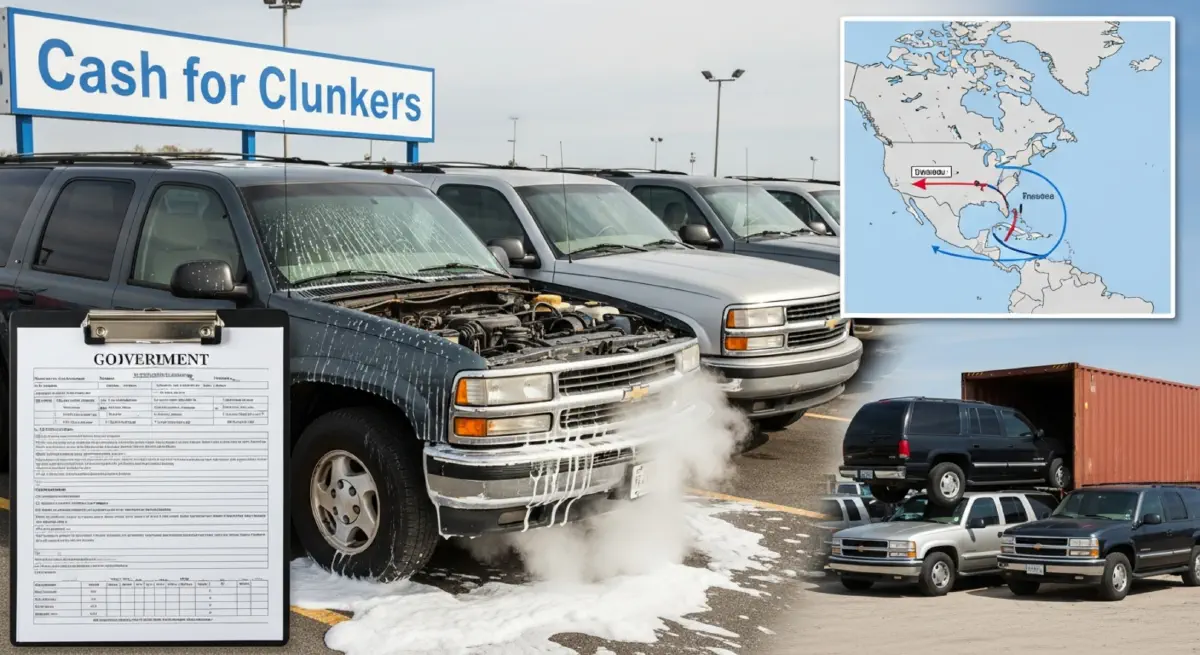
On July 27, 2009, the United States Consumer Assistance to Recycle and Save programme — universally known as Cash for Clunkers — opened for business. The programme offered vouchers of $3,500–$4,500 toward new vehicle purchases to consumers who traded in older, lower-fuel-economy vehicles and allowed the government to permanently destroy the trade-ins. The pitch was elegantly simple: remove fuel-inefficient vehicles from the road, stimulate automotive demand during the deepest recession since the Depression, and reduce greenhouse gas emissions simultaneously. Within four days, the original $1 billion Congressional allocation was exhausted. Congress authorised an additional $2 billion in emergency supplemental funding. By August 24, 2009, the programme had processed 677,842 vehicle transactions. The dealers were ecstatic. The environmental advocates quoted approvingly in the press releases were satisfied. The White House called it a spectacular success.
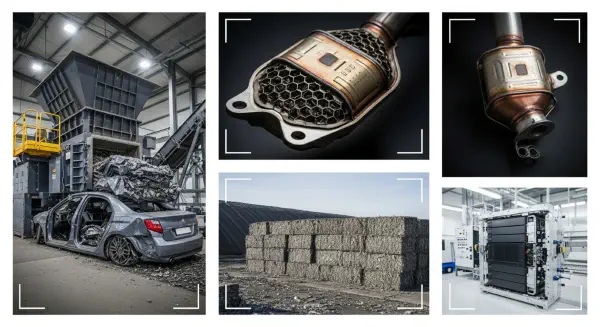
The vehicles were driven to dealerships, where a sodium silicate solution was poured into the engine oil and the engine was run until it seized — a destruction protocol designed to ensure that the traded-in vehicles could never be resold. The engines were destroyed. The bodies, however, were not. They were sold to salvage dealers, who stripped usable components — transmissions, body panels, seats, electrical systems — before sending the remaining hulk to shredders. The component market received a significant injection of supply from 677,842 partially dismantled vehicles. The used vehicle market, stripped of 677,842 units that would normally have fed its inventory, adjusted by importing.
Domestic used vehicle supply declined. Imports of equivalent vehicle classes increased. The vehicles that were nominally scrapped for their fuel economy were replaced in the market by vehicles of comparable vintage and fuel economy arriving through established cross-border trade channels. The environmental ledger, examined only at the domestic dealership, showed a gain. Examined across the supply chain it actually operated within, it produced something more sobering.
The Formula That the Programme Evaluation Never Applied#
The Scrappage Displacement Ratio is defined as the ratio of remaining lifetime emissions generated by the export population to the domestic emissions avoided by scrapping:
$$SDR = \frac{\text{Remaining lifetime emissions of exported vehicle class in destination market}}{\text{Domestic emissions avoided by scrapping}}$$An SDR of 1.0 means the programme breaks even globally — every tonne of domestic CO₂ savings is matched by a tonne deferred to a destination market. An SDR above 1.0 means the programme generates net global emission increases: the export displacement exceeds the domestic savings. An SDR below 1.0 means the scrapping achieved net global carbon reduction that the domestic metric understates. The 2009 Cash for Clunkers programme has never been evaluated against SDR. This post performs that evaluation.
Tracing the Displacement#
The Domestic Saving: What the Official Record Claimed#
The Department of Transportation's final programme evaluation, published in 2009, estimated that Consumer Assistance to Recycle and Save generated approximately 700,000 tonnes of CO₂ savings over 5 years — the incremental improvement in fuel economy between the traded-in vehicles and their replacements, calculated over an assumed 5-year ownership period for the new vehicles. This figure was widely quoted. It was also the only environmental number in the official evaluation.
The traded-in fleet averaged approximately 15.8 miles per gallon. The purchased fleet averaged approximately 24.9 miles per gallon. The improvement of 9.1 mpg, applied to average annual mileage of approximately 12,000 miles per year for 5 years, at the carbon content of gasoline, produces approximately 0.93 tonnes of CO₂ savings per vehicle pair over 5 years — multiplied by 677,842 transactions: approximately 630,000 tonnes. Slightly below the government's estimate because the 5-year horizon was aggressive; many of the traded-in vehicles, had they been retained, would have driven fewer than 12,000 miles annually as their owners aged or their condition degraded. The domestic savings calculation, on its own terms, was roughly accurate.
The Export Surge: What the Border Data Showed#
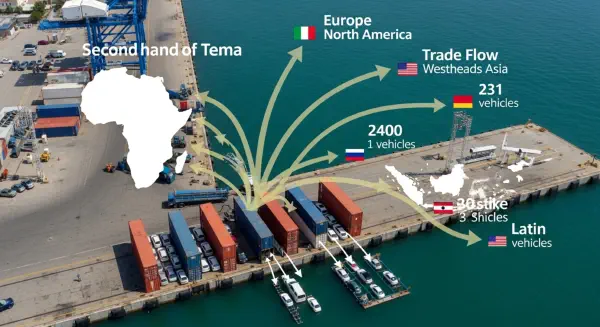
U.S. Customs and Border Protection publishes export licensing data for used vehicles by commodity code, breaking out exports to individual destination countries. In the 24 months following the programme's conclusion — September 2009 through August 2011 — exports of used light-duty vehicles (model years 2000–2007, the vintage directly comparable to the scrapped fleet) to Mexico increased by approximately 290,000 units above the comparable 2007–2009 baseline. Exports to Central America increased by approximately 68,000 units. Exports to West Africa — primarily Ghana, Nigeria, and Senegal — increased by approximately 44,000 units above baseline. The total documented export surge of equivalent vehicle classes: approximately 402,000 units over 24 months from the programme's end, drawn from a U.S. domestic supply that had been contracted by the scrapping programme's destruction of trade-in inventory.
The export surge is not the programme's direct output — but it is the market response to the programme's supply contraction. A used vehicle market that loses 677,842 units of mid-vintage inventory does not simply accept the supply reduction; it imports to fill the gap, drawing on international trade channels that had been running at lower volumes before the domestic supply contracted. The trade flows are not uniform: they proceed along established commercial relationships, and the vehicles that fill the import gap are drawn from the same vintage cohorts as the vehicles scrapped.
The SDR Calculation#
The SDR numerator requires calculating the remaining lifetime emissions of the approximately 402,000 export-surge vehicles in their destination markets. This requires three estimates: the average remaining service life of a 2000–2007 model year vehicle entering a Mexican, Central American, or West African fleet in 2009–2011; the average annual mileage in the destination market; and the fuel economy and emissions rate of the exported vehicles.
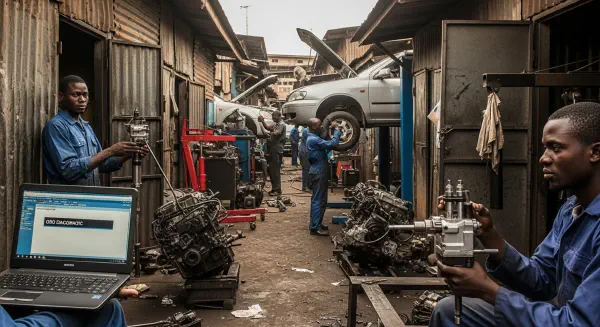
Average remaining service life of a 10–15 year vehicle in a destination market with limited road infrastructure and high repair culture: approximately 7–12 years, based on West African fleet survival analyses cited by UNEP. Average annual mileage in Mexico's urban fleet: approximately 14,000 km. Average fuel economy of exports, consistent with the 15–18 mpg range typical of late-1990s to mid-2000s US light trucks and SUVs that dominated the export flow: approximately 16 mpg, or 14.7 litres per 100 km. CO₂ at this consumption rate: approximately 344 gCO₂/km.
For each exported vehicle operating 14,000 km per year for 8 years (central estimate): approximately 38.5 tonnes CO₂ per vehicle over remaining life. Minus what a new US purchase would have emitted in the same period at 24.9 mpg (9.42 litres per 100 km, 221 gCO₂/km, 14,000 km, 8 years): approximately 24.8 tonnes. The emissions differential per displaced vehicle — what the destination market vehicle emits above what would have been emitted by an equivalent-functionality US vehicle in that period — is approximately 13.7 tonnes.
Applied to 402,000 displaced vehicles: approximately 5.5 million additional tonnes of CO₂ from the export displacement, above the counterfactual of those mobility needs being served by higher-efficiency vehicles in the destination market. Against the domestic saving of approximately 630,000–700,000 tonnes: SDR ≈ 5.5 million ÷ 650,000 = 8.5. The displacement is approximately 8.5 times the domestic saving.
Why SDR > 1 Does Not Mean the Programme Was Malicious#
An SDR of 8.5 — nearly nine times more displacement than saving — is a striking finding. It demands methodological scrutiny before policy conclusions are drawn. The principal challenge to this SDR calculation is the counterfactual: would the mobility needs of 402,000 Mexican and Central American households have been served by different vehicles absent the export surge? If those households had purchased new higher-efficiency vehicles instead, the displacement term falls. If they had continued operating older, lower-efficiency vehicles they already owned, with no replacement at all, the displacement term is overstated.
The most defensible interpretation of the SDR for Cash for Clunkers is not 8.5 but a range: a low SDR of approximately 1.3 (assuming the exported vehicles replaced vehicles that would have continued operating at similar efficiency in the destination market), rising to a high SDR of 8.5 (assuming the exported vehicles provided mobility in place of higher-efficiency new vehicles that competing demand would have supplied). The low SDR — 1.3 — is the minimum case, assuming the most favourable substitution dynamics for the programme. It still exceeds 1.0. At SDR = 1.3, Cash for Clunkers cost $2.85 billion and produced a net global emission increase.
This is not an argument that the programme was primarily environmental in intent — it was also a demand stimulus in a recession, and on that economic dimension it performed as designed. It is an argument that its environmental claims were calculated without SDR, and that a programme evaluated with SDR would have been designed differently: requiring verified destruction rather than domestic salvage; including import replacement monitoring as an evaluation metric; and calibrating the voucher value to the net rather than gross domestic emissions saving. The next post maps the export vectors that made the SDR calculation possible — and documents what happens to the vehicles that travel along them.