The Announcement and the Supply Chain Behind It#
In November 2021, the Biden Administration convened a critical minerals summit that produced a set of commitments from twelve allied nations to diversify the battery supply chain away from Chinese processing dominance. The communiqué cited the IEA’s 2021 critical minerals report, which had documented the concentration risks in lithium, cobalt, nickel, and rare earth elements. Secretary of Energy Jennifer Granholm described the initiative as building “the supply chains of the future.” The G7 and subsequent Minerals Security Partnership announcements through 2022–2023 followed the same framing: map the problem, announce the partnerships, fund the alternative supply chains.
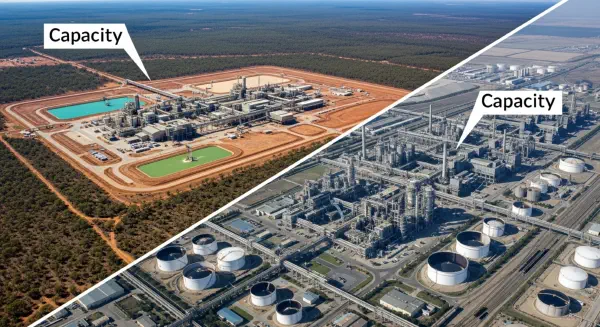
The problem was well-mapped. Its arithmetic, however, ran in two directions that the summit communiqués conflated. Supply chain concentration exists at two structurally distinct stages that are sometimes co-located but often substantially separated: the mining stage, where the ore is extracted from the ground; and the processing stage, where the ore is converted into the battery-grade chemical compound that cell manufacturers actually purchase. These two stages have different geographies, different capital requirements, different timelines for new capacity development, and different degrees of concentration. Most importantly, they have different vulnerability profiles for a supply disruption.
The standard metric for supply chain concentration — the Herfindahl-Hirschman Index, used by antitrust authorities globally to measure market concentration — measures market share squared, summed across all market participants. It captures the mining stage well, because mining market share is what commodity trading tracks and what trade statistics report. It captures the processing stage poorly, because processing concentration is frequently higher than mining concentration, and the HHI of the mining stage is what policy documents cite when they describe supply chain vulnerability. The IRA’s domestic content requirements — the legislative mechanism designed to address battery supply chain concentration — are calibrated to mining origin. The processing chokepoint gets no specific provision in the domestic content framework.
The Chemistry of Dependence#
What a Battery Actually Requires From the Periodic Table#
The specific mineral requirements of lithium-ion batteries depend on the cathode chemistry. Three chemistries dominate commercial EV deployment: NMC (lithium nickel manganese cobalt oxide), NCA (lithium nickel cobalt aluminium oxide), and LFP (lithium iron phosphate). Each has distinct mineral contents per kilowatt-hour of capacity, and the projected mineral demand of the EV transition depends on the market share of each chemistry, which is itself a moving target as OEM sourcing decisions and cost pressures shift chemistry preferences.
NMC 811 — the high-nickel formulation that Tesla, BMW, and Hyundai deploy in long-range EVs — requires approximately 35–40 kg of lithium carbonate equivalent (LCE), 40–50 kg of nickel, and 5–7 kg of cobalt per 75 kWh of battery capacity. NCA, used in older Tesla formats, is similarly nickel-intensive. LFP, used by BYD and increasingly by Tesla in standard-range variants, requires approximately 40–45 kg of LCE and negligible cobalt and nickel — a significant compositional shift that the market share increase of LFP (from approximately 15% of global EV battery volume in 2018 to approximately 40% in 2023) has material implications for cobalt and nickel demand trajectories.
The IEA’s 2021 Sustainable Development Scenario projects that EV battery demand will increase total lithium demand by approximately 40× between 2020 and 2040: from approximately 50,000 tonnes LCE per year to approximately 2 million tonnes LCE per year. Cobalt demand increases approximately 7× through 2030, decelerating thereafter if high-nickel and LFP chemistries continue their market share gains. Nickel demand for batteries increases approximately 19× by 2040, with the specific demand falling on the battery-grade Class I nickel that sulphide ore deposits in Canada, Australia and Russia have historically dominated — a different nickel market from the laterite-ore Class II nickel that Indonesia is rapidly expanding, whose conversion to battery-grade nickel sulphate requires additional hydrometallurgical processing.
Mining Geography Versus Processing Geography#
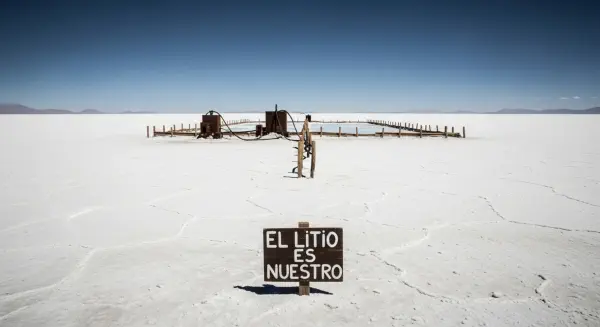
The mining geography of critical battery minerals is more dispersed than the processing geography — and it is this difference that the PCI metric is designed to quantify. Lithium mining is dominated by the “lithium triangle” of Chile, Australia, and Argentina, providing approximately 85% of global lithium supply in brine and hard-rock form as of 2023, with China contributing approximately 10–15%. Cobalt mining is concentrated in the Democratic Republic of Congo (approximately 70% of global supply), with Australia, Philippines, Cuba, and Russia providing most of the remainder. Nickel mining supply is distributed across Indonesia (approximately 37%), the Philippines (approximately 10%), Russia (approximately 8%), Canada, Australia, New Caledonia, and Brazil.
The mining-stage HHI for each mineral: lithium approximately 2,400 (moderately concentrated by DoJ standards; the threshold for “highly concentrated” is 2,500); cobalt approximately 4,500 (highly concentrated); nickel approximately 1,400 (moderately concentrated). These figures reflect genuine supply dependency for cobalt and a manageable but monitored concentration for lithium and nickel at the mining stage.
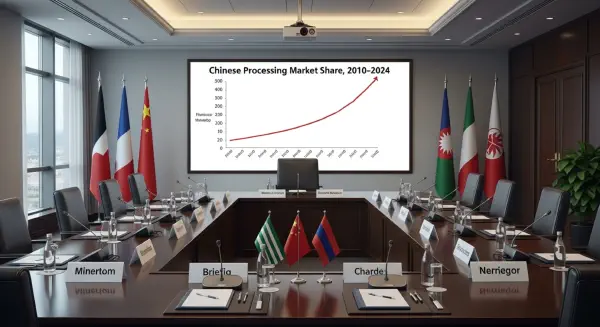
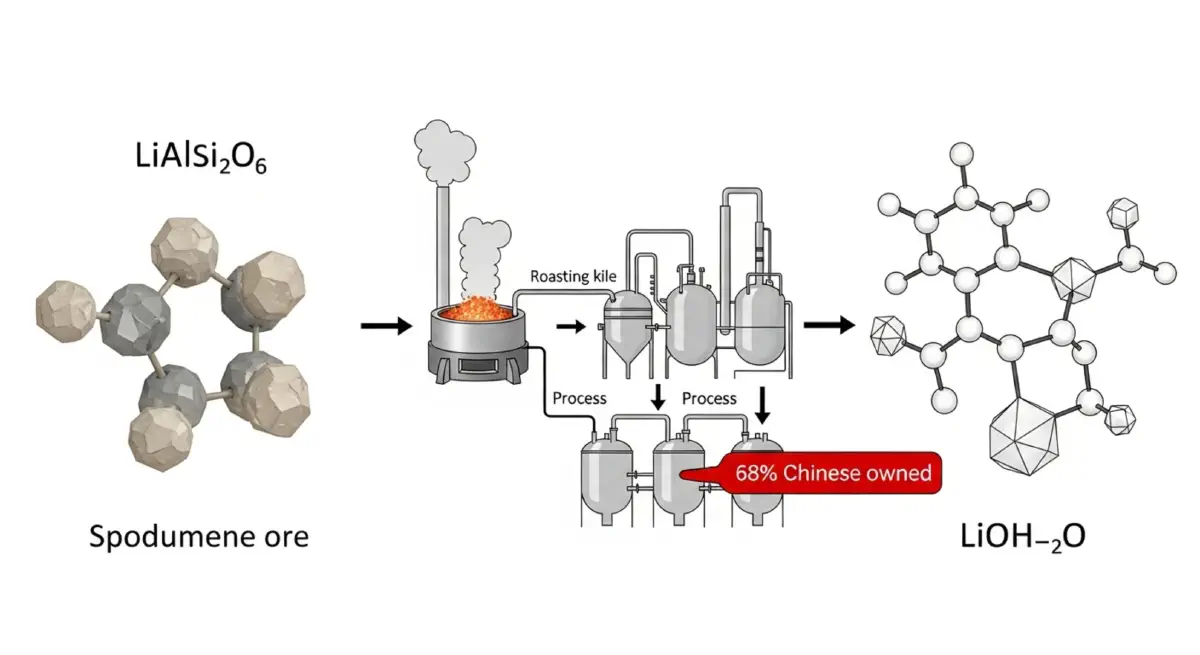
Processing geography is different in direction and degree. Lithium hydroxide processing is approximately 68% Chinese. Cobalt refining is approximately 72% Chinese. Nickel sulphate (battery-grade Class I nickel) production is approximately 60% Chinese. Rare earth oxide separation and processing is approximately 88% Chinese. The processing-stage HHI for lithium hydroxide: approximately 4,800, double the mining-stage figure. For cobalt refining: approximately 5,400, comparable to the mining-stage concentration but achieved through processing rather than ore access. For rare earth permanent magnet precursors: approximately 8,500, versus a mining HHI of approximately 5,800.
The PCI Formula and Its Calibration#
The Processing Concentration Index is defined as:
$$PCI = \sum_{i} \left( s_i^2 \times \frac{p_i}{m_i} \right)$$where $s_i$ is country $i$’s share of global processing capacity, $p_i$ is country $i$’s processing share, and $m_i$ is country $i$’s mining share. For a country where processing share equals mining share, the amplification factor $p_i/m_i = 1$ and the PCI equals the standard HHI. Where processing share substantially exceeds mining share — as for China in lithium, cobalt, and rare earths — the amplification factor exceeds 1 and the PCI rises above the HHI. The PCI captures what the HHI misses: that market power in processing can be built on mineral imports rather than mineral deposits, creating a chokepoint where a country controls the transformation of raw materials it does not primarily mine.
For lithium hydroxide, applying China’s processing share ($s_i = 0.68$) and amplification ($p_i/m_i = 0.68/0.22 = 3.09$): China’s PCI contribution = $0.68^2 \times 3.09 = 0.4624 \times 3.09 = 1.43$. Australia’s PCI contribution (10% of processing, 55% of mining): $0.10^2 \times (0.10/0.55) = 0.01 \times 0.18 = 0.002$. The Chile contribution (adding emerging processing capacity): similarly small amplification. Summing across all contributors and scaling to the 0–10,000 range standard for HHI: PCI ≈ 6,800, against the mining-stage HHI of 2,400.
The next post examines the policy response to this characterisation — particularly why the IRA’s domestic content provisions target the mining stage, what IRA compliance actually requires, and where the policy’s calibration creates a known gap between the stated objective of supply-chain resilience and the concentration stage where supply disruption risk is actually most acute.