The Monitoring Station That Measures the Wrong Thing#
London’s urban air quality monitoring network is among the densest in the world. The London Air Quality Network maintains more than 150 monitoring stations across 33 boroughs, reporting PM₂.₅ and PM₁₀ concentrations continuously against legal limits set in the UK Ambient Air Quality Standards derived from the EU Ambient Air Quality Directive. The data is public, granular, and institutionally cited in every policy document from the Mayor’s office that addresses road transport’s contribution to urban air quality.
What the monitoring network measures is ambient concentration. It does not, in any routine operational sense, attribute that concentration to sources. The PM₂.₅ reading at the Marylebone Road monitoring station on a Tuesday morning measures the total mass of particles below 2.5 micrometres per cubic metre of air — exhaust, non-exhaust, secondary particles, long-range transport, industrial sources, and domestic heating combined. Source apportionment — the statistical methodology that decomposes the total concentration into contributing sources — is performed episodically, by research institutions, using receptor modelling that requires extensive sampling campaigns. It is not a live regulatory tool. The daily PM₂.₅ exceedance notification that appears in the London Air Quality app does not tell its reader whether the elevated concentration came from brake dust, exhaust particulate, continental aerosol transport, or wood smoke from domestic hearths in Kent.
This attribution gap has a specific regulatory consequence: the emissions reductions achieved by Euro 6d exhaust standards do not reduce ambient PM₂.₅ concentrations by the proportional amount that headline exhaust emission figures suggest. The non-exhaust component — which is not being reduced by Euro 6d — continues contributing, and its proportional share of the total rises as exhaust contributions fall.
What Source Apportionment Actually Finds#
The Research Evidence on Non-Exhaust Contribution#
The authoritative evidence on non-exhaust emissions contributions to urban PM₂.₅ comes from the source apportionment research literature, which has expanded dramatically in scope since 2010 as the exhaust fraction declined and the residual non-exhaust contribution became analytically visible. Harrison et al. (2012) applied a combination of chemical marker analysis and receptor modelling to London PM₁₀ monitoring data and attributed approximately 7–8% to brake wear and approximately 7% to tire and road wear — together approximately 14–15% of total PM₁₀ from direct traffic non-exhaust sources, compared with approximately 6% from exhaust. At that date, non-exhaust traffic PM₁₀ exceeded exhaust traffic PM₁₀ in London by more than a factor of two.
By 2021, a Joint Air Quality Unit analysis for the UK Department for Environment, Food & Rural Affairs estimated that non-exhaust sources accounted for approximately 60% of direct PM₂.₅ from road transport specific sources in UK urban environments — a figure that explicitly excludes resuspension, which would raise the non-exhaust proportion further. The European Environment Agency’s 2022 Air Quality in Europe report confirmed the cross-European version of the same dynamic: as exhaust PM₂.₅ from new Euro 6 vehicles approached measurement limits, the non-exhaust component accounted for the majority of transport PM₂.₅ in compliant urban fleets.
The NEPF reading at the fleet level in major European cities with high Euro 6 compliance rates: approximately 80–90%. The non-exhaust fraction already dominates urban transport PM₂.₅. The transition to zero-exhaust electric vehicles, predicted to push NEPF toward 100% in new vehicle cohorts, will not reduce the transport PM₂.₅ burden commensurately with the reduction in exhaust emissions. It will consolidate a situation where 100% of transport PM₂.₅ comes from a source category that has no regulatory limit.
The Health Cost That Street-Level Concentration Numbers Conceal#
PM₂.₅ causes mortality and morbidity through well-characterised biological mechanisms: oxidative stress, inflammatory response, and cardiovascular effects from particles that penetrate to the pulmonary alveoli, enter the circulatory system, and reach the heart, brain, and other organs. The Global Burden of Disease study attributes approximately 4.2 million premature deaths per year globally to outdoor fine particulate matter exposure — the third leading environmental risk factor for mortality.
The health cost per unit of PM₂.₅ concentration imposed on a population is calculable through dose-response relationships published by the WHO, integrated over the exposed population’s demographic profile. The WHO Air Quality Guidelines (2021) set an annual average PM₂.₅ guideline of 5 μg/m³. The EU Ambient Air Quality Directive limit — 25 μg/m³ annual average through 2030, reducing to 10 μg/m³ in 2030 under the proposed revision — is set substantially above the WHO guideline because of the economic and infrastructure feasibility constraints that realistic standards must navigate. The gap between the WHO guideline and the EU limit represents a quantifiable additional disease burden that European policy has accepted as manageable.
The health cost of PM₂.₅ is not uniform by source. The composition of the particle determines its toxicological profile — and tire and brake particles have distinctly different compositions than combustion particles. Zinc compounds, prominent in tire wear particles, are a known pulmonary irritant at elevated concentrations. Metallic particles from brake wear contain antimony, copper, barium, and iron at concentrations substantially above ambient background. The relative toxicity factor of traffic non-exhaust particles relative to combustion PM₂.₅ is an active research question, with studies suggesting comparable or potentially higher per-mass toxicity for metallic non-exhaust fractions. The WHO guidelines, derived from epidemiological studies of total PM₂.₅ without source-composition breakdown, may underestimate the health impact of non-exhaust PM₂.₅ if its specific composition carries a higher toxicity coefficient.
Why the Low Emission Zone Cannot Fix the Non-Exhaust Problem#
The policy instrument most deployed to address urban traffic PM₂.₅ concentrations is the Low Emission Zone or Ultra Low Emission Zone: a geographic boundary within which vehicle access is restricted to vehicles meeting minimum emissions standards. London’s ULEZ, which extended to outer London in August 2023, restricts petrol vehicles not meeting Euro 4 standards and diesels not meeting Euro 6 standards. The Dutch environmental zones (milieuzone) apply similar restrictions in city centres. Paris extends ZCR restrictions to cover most of its central arrondissements.
These instruments are targeted at exhaust emissions, because exhaust emissions are what the certification standards regulate and what the enforcement mechanism — based on vehicle type approval records — can verify. A Euro 6d diesel that meets the access standard generates almost no exhaust PM₂.₅. It generates the same non-exhaust PM₂.₅ per kilometre as the Euro 4 vehicle it replaced. An electric vehicle that generates zero exhaust PM₂.₅ and gains free access to the ULEZ generates non-exhaust PM₂.₅ at rates potentially exceeding the Euro 4 vehicle that was excluded. The Low Emission Zone as designed is an exhaust emission zone. It has no mechanism to reduce the non-exhaust component that already accounts for the majority of transport PM₂.₅ in compliant fleets.
The Measurement Gap That Compounds the Regulatory Gap#
The absence of non-exhaust PM₂.₅ limits in vehicle certification creates a parallel absence in market signals. No tire manufacturer is required to disclose tire wear particle generation rates, chemical composition of shed particles, or 6PPD-quinone formation potential per kilometre of urban driving. No automotive manufacturer is required to report the non-exhaust PM₂.₅ contribution of their vehicle in any technical documentation provided to regulators or consumers. The WLTP test cycle, which produces the official fuel consumption and CO₂ figures used in EU fleet-average compliance calculations, has no particle generation measurement protocol for non-exhaust sources.
The regulatory gap in particle certification, applied to the growing fleet of heavy BEVs in European and North American urban environments, creates a compounding monitoring problem: ambient PM₂.₅ concentrations are not declining commensurately with the fleet electrification narrative that policymakers are using to justify current transport policy. Cities that have declared clean air zones and accelerated EV adoption through access rights and subsidies will find, if source apportionment is conducted rigorously, that their transport PM₂.₅ reduction has lagged their exhaust emission reduction by a substantial margin. The NEPF metric provides the framework to understand why: when 90–100% of transport PM₂.₅ comes from the tires and brakes, removing the exhaust pipe from the vehicle does not remove the pollution. It removes the measurement instrument that had been capturing a minority of it.
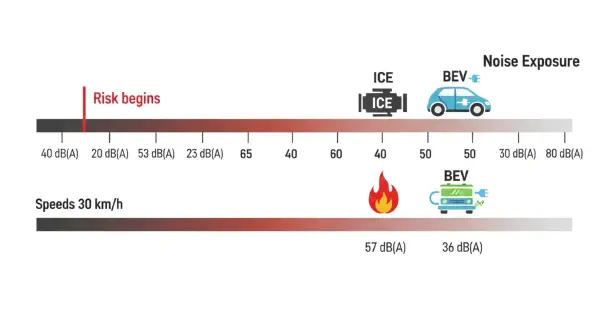
The next post examines the noise dimension of the particulate account — the second unregulated output of road transport that generates health costs comparable in magnitude to PM₂.₅ exposure but is treated as an amenity issue rather than a public health crisis.