The Bridge That Was Never Rebuilt After the First One Fell#
On the morning of August 1, 2007, the I-35W Mississippi River Bridge in Minneapolis failed during the evening rush hour, dropping 111 metres of eight-lane interstate into the river. Thirteen people died. The National Transportation Safety Board investigation identified the immediate cause as an undersized gusset plate in the original 1967 design, stressed beyond tolerance by construction equipment staged on the bridge deck. But the NTSB report also noted that the bridge had been rated "structurally deficient" — a federal designation indicating known significant deficiencies — for 17 years before it fell. It had been inspected, rated, and documented as deficient. It had not been rebuilt.
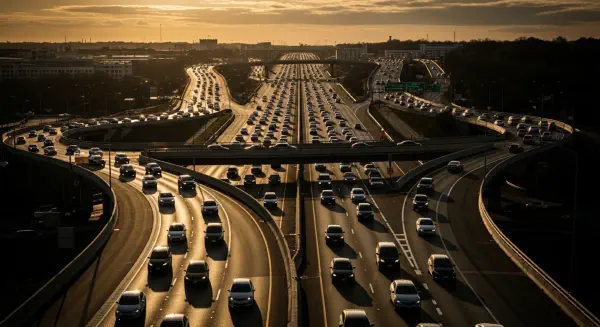
The Minneapolis bridge was not an outlier. More than 7,500 U.S. bridges carry the structurally deficient designation as of 2023. The Federal Highway Administration defines structurally deficient as having a component rated 4 or below on a 0–9 scale — meaning a known deficiency, not an imminent collapse risk in most cases, but a documented maintenance deficit that represents public liability. The I-35W collapse illustrated the statistical boundary condition: a known deficiency, unfunded for two decades, that eventually crossed from deficiency to catastrophic failure at a moment determined by the interaction of construction load and design tolerance, not by any predictive model.
The American Society of Civil Engineers estimates the U.S. deferred road and bridge maintenance backlog at approximately $1.1 trillion as of its 2023 Report Card — maintenance that the existing infrastructure requires and that current road fund revenues cannot cover. This figure is not a projection. It is a tabulation of documented, inspected, federally recorded maintenance need that exists now, on roads that are currently in service, that will cost more to repair the longer it remains deferred. It is the accumulated product of a road investment financing system that has, for structural reasons, consistently prioritised building new capacity over maintaining what was already built.
The Revenue That Cannot Keep Up With the Liability#
The federal highway fund is financed primarily through the federal motor fuel excise tax — 18.4 cents per gallon of gasoline and 24.4 cents per gallon of diesel, rates that have been frozen since 1993. In nominal terms, they have not increased in 31 years. In inflation-adjusted terms, they have lost approximately 43% of their purchasing power since 1993. Every year, the revenue purchasing power of the federal fuel tax declines relative to the cost of the road construction and maintenance it funds, while vehicle fuel efficiency improvements reduce the number of gallons purchased per vehicle-mile travelled, further eroding the per-VMT revenue base.
State fuel taxes and vehicle registration fees add to the federal base but follow similar structural dynamics in most states. The combination of revenues from all user-fee sources — federal and state fuel taxes, vehicle registration fees, tolls, and weight-distance charges — covers approximately 50–60% of total road sector expenditure in the United States, as documented in the FHWA's Highway Statistics series. The remainder — between $50 billion and $80 billion annually — is transferred from general public revenue: property taxes, income taxes, and sales taxes paid by all residents, including those who do not drive, to fund infrastructure that is used only by drivers. No publication of vehicle total cost of ownership that I have found includes this transfer in its calculation. It is the largest invisible subsidy in the automotive economy.
The Road Subsidy Multiplier: What Every Construction Dollar Actually Costs#
The Lifecycle Cost That Construction Budgets Do Not Include#
Road infrastructure has a characteristic maintenance cost structure that is inverse to construction cost timing: construction cost is borne upfront, while the bulk of the lifecycle expense is distributed over decades in the form of resurfacing, pothole repair, bridge maintenance, drainage system replacement, and eventually full reconstruction. The standard asphalt road surface has functional life of 15–25 years before requiring major rehabilitation or reconstruction, depending on traffic loading and climate. Each reconstruction cycle typically costs 40–65% of the original construction cost at current prices, repeated multiple times over the road's service life.
A standard Interstate highway lane-mile costs approximately $8–16 million to construct (varying by geography, subgrade conditions, and interchange complexity). Over a 50-year service period, pavement rehabilitation, bridge maintenance, and drainage system work add a further $12–18 million per lane-mile at present-value equivalent costs — before any traffic-growth-driven reconstruction. The lifecycle cost-to-construction-cost ratio for a standard Interstate lane-mile, over its first 50 years, is approximately 2.0–2.5.
For urban arterial and freeway construction — where higher traffic volumes accelerate pavement degradation, where subsurface complexity increases maintenance cost, and where the urban heat island effect reduces pavement life — the lifecycle ratio is higher: approximately 2.5–3.5 over 50 years.
The Induced Demand Term That Standard Analysis Omits#
The Road Subsidy Multiplier incorporates a cost component that standard lifecycle analysis does not: the reconstruction cost attributable to induced demand — the additional VMT that highway expansion itself generates, which accelerates pavement degradation beyond the level assumed in the original design brief.
$$RSM = \frac{\text{20-year lifecycle maintenance cost} + \text{induced demand reconstruction cost}}{\text{initial construction cost}}$$Road pavement life is an inverse power function of traffic loading: the standard pavement design equation relates pavement life to axle load equivalents per day, with exponential sensitivity to axle weight but also significant sensitivity to total traffic volume. A pavement designed for 40,000 vehicles per day that, within seven years of opening, carries 55,000 vehicles per day due to induced demand experiences pavement life reduction of approximately 18–27%, depending on the mix of vehicle classes. This premature degradation triggers resurfacing and rehabilitation cycles earlier than budgeted, adding a lifecycle cost that is not assigned to the capacity expansion that caused it. It is absorbed in the routine maintenance budget as a system-wide cost increase.
The Texas Transportation Institute has documented that in 80% of urban corridor expansions studied between 1990 and 2020, projected free-flow travel time benefits had substantially deteriorated within 5–7 years of project completion. The reason is consistent: induced demand — additional vehicle trips and longer-distance routing enabled by the new capacity — filled the expanded road faster than projected. Each of those additional trips added to pavement loading, and cumulatively advanced the maintenance timeline by years.
The RSM Applied to a Documented Case#
Texas DOT's SH-99 Grand Parkway expansion — a 185-mile outer loop highway encircling Houston, built in segments from 2014 through 2023 at a total construction cost of approximately $4.1 billion — is a well-documented case for RSM calculation.
The Grand Parkway was designed for traffic volumes ranging from 30,000 to 80,000 vehicles per day in different segments at buildout. By 2022, segments completed in 2014–2016 were carrying volumes 22–35% above design projections. The Texas Department of Transportation's maintenance planning records — publicly available through the state's open data portal — project pavement rehabilitation for the highest-impact segments approximately six years ahead of the original maintenance schedule. Adjusted for 20-year lifecycle cost at current prices, with the accelerated rehabilitation included: the estimated 20-year public obligation for SH-99 is approximately $3.1 billion in maintenance plus approximately $900 million in induced-demand-attributed early rehabilitation — against an initial construction cost of $4.1 billion.
RSM = ($3.1B + $0.9B) ÷ $4.1B = 0.98, or a total lifecycle public obligation of approximately 1.98× the original construction cost. For a suburban greenfield highway, RSM is near 2.0 — consistent with the baseline lifecycle ratio. The induced demand component is proportionally smaller because the surrounding area is still developing and baseline development density has not yet reached the point where induced demand escalates rapidly.
The comparable calculation for the completed segment of Houston's I-45 widening — an urban freeway in an already dense corridor, where every added lane-mile generates higher induced VMT on existing pavement — produces an RSM of approximately 3.2–3.8 when the full induced demand reconstruction term is included. This is the range where every dollar of highway expansion generates more than three dollars in 20-year public obligation — and where the fiscal case for expansion, routinely approved by DOT cost-benefit analysis, does not withstand RSM scrutiny. The next post examines why DOT models are calibrated to prevent them from seeing that number.
The Debt That Deferred Maintenance Makes Compound#
The $1.1 trillion deferred maintenance backlog is not a one-time stock of unfunded need. It is a compounding liability, because deferred pavement maintenance increases reconstruction cost at a documented rate: a pothole-stage repair costs approximately $50–150 per square metre; a mill-and-fill resurfacing costs approximately $12–18 per square metre but requires full access closure; base-failure reconstruction costs $35–65 per square metre with full closure. A road that requires resurfacing at year 15 at $12/m² but receives no maintenance until year 22 requires base-failure reconstruction at $50/m² — more than four times the cost that timely maintenance would have incurred.
The maintenance backlog is a RSM liability that compounds precisely because the fiscal structure of road funding optimised for construction over maintenance: political benefits of ribbon-cutting accrue immediately, while maintenance costs accrue in future budget cycles often under different administrations. The gas tax that cannot keep up with construction cost inflation is also the gas tax that cannot fund maintenance without cutting new construction. The road system is, structurally, a machine for producing future obligations that its current revenue model cannot service — and the RSM makes the scale of that machine's output, for any given expansion decision, calculable in advance.