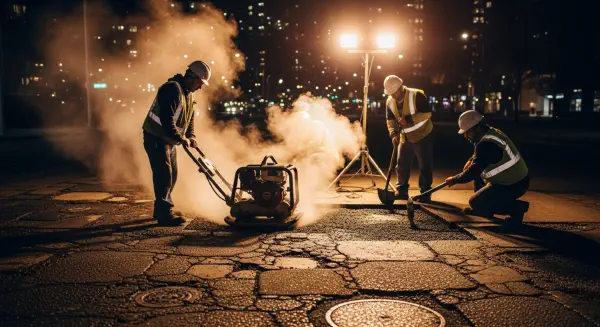
Road Infrastructure Is the Largest Subsidy to Private Automobile Use, and Almost None of It Appears in TCO Calculations: The American Society of Civil Engineers estimates the US deferred road maintenance backlog at approximately $1.1 trillion as of 2023. Federal, state, and local fuel taxes and vehicle user fees cover approximately 50–60% of total road expenditure. The remainder — between $50 billion and $80 billion annually — is transferred from general property tax, income tax, and sales tax revenue to road infrastructure subsidy. No private automobile total cost of ownership calculation includes this transfer. It is the largest invisible component of automotive economics.
The Road Subsidy Multiplier Converts Construction Cost Into a Liability Multiplier: RSM = (20-year lifecycle maintenance cost + induced demand reconstruction cost) ÷ initial construction cost. RSM > 1 means every construction dollar generates more than one dollar in future public obligation. For documented urban highway expansion cases, RSM ranges from 2.1 to 4.8. The standard DOT cost-benefit analysis does not include RSM and therefore systematically understates the full fiscal cost of expansion investment.
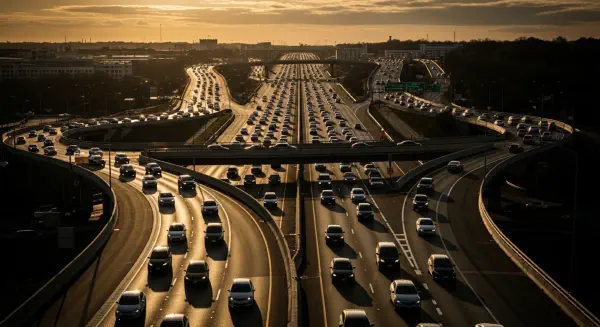
Induced Demand Is an Empirical Fact, Not a Conjecture: Research by Duranton and Turner (2011), using US highway data spanning 1983–2003, found a long-run elasticity of vehicle-miles traveled with respect to lane-miles of approximately 1.0 — meaning a 10% increase in lane-miles produces a 10% increase in VMT. Official DOT traffic models apply induced demand elasticities of 0.0–0.2 — a systematic downward bias documented by the Texas Transportation Institute as producing congestion relief projections that fail within 5–7 years of project completion in 80% of urban corridor expansions studied.
The Comparison With Transit Investment Is Suppressed by the Analysis Framework: RSM applied to a Metro rapid transit investment typically falls between 0.3 and 0.8 — meaning transit requires 30–80% of its initial construction cost in lifecycle maintenance, with no induced demand feedback. Urban highway RSM of 2.5–4.8 means the highway requires 2.5–4.8 times its construction cost in public lifecycle obligation. The analysis framework that excludes RSM from highway evaluation while requiring lifecycle cost disclosure for transit projects is not neutral. It is calibrated to produce infrastructure decisions that favour road investment.
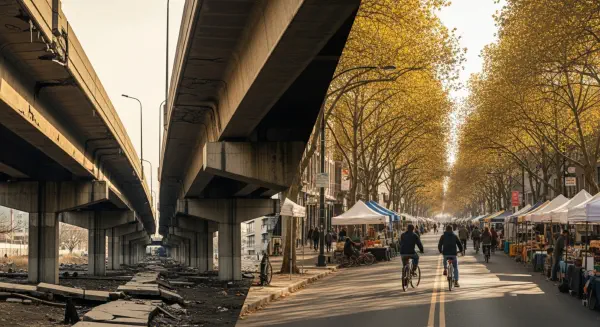
Retrofitting Car-Centric Design Is More Expensive Than Not Building It: A comprehensive cost-benefit analysis of the removal of urban elevated highways — the Embarcadero in San Francisco, the Cheonggyecheon Freeway in Seoul, the Inner Loop in Rochester NY — consistently shows that demolition and replacement with mixed-use street networks generates positive economic returns within 15–20 years. The retrofit costs per lane-mile of urban highway removal range from $8 million to $35 million. The 50-year RSM-adjusted liability avoided by not building the original structure typically exceeds the removal cost by 3–5 times. The case for not building high-RSM infrastructure is stronger than the case for removing it after construction — and the RSM framework makes that argument before the first shovel breaks ground.
American Society of Civil Engineers. (2023). 2023 report card for America's infrastructure. ASCE.
Duranton, G., & Turner, M. A. (2011). The fundamental law of road congestion: Evidence from US cities. American Economic Review, 101(6), 2616–2652. https://doi.org/10.1257/aer.101.6.2616
Federal Highway Administration. (2023). Highway statistics series 2022: Motor fuel and vehicle taxes. U.S. Department of Transportation.
Texas Transportation Institute. (2023). 2023 urban mobility report. Texas A&M Transportation Institute.
Litman, T. (2023). Transportation demand management: Benefits, costs, and equity impacts (Policy Analysis). Victoria Transport Policy Institute.
Litman, T. (2022). Whose roads? Defining bicyclists' and pedestrians' right to use public roadways (Policy Analysis). Victoria Transport Policy Institute.
National Surface Transportation Policy and Revenue Study Commission. (2008). Transportation for tomorrow: Report of the National Surface Transportation Policy and Revenue Study Commission. U.S. DOT.
Brown, A., Bhattacharya, S., & Taylor, B. D. (2009). Motor vehicles per capita and public transit use. Transportation Research Record, 2110, 1–9.
Buehler, R., & Pucher, J. (2017). Trends in walking and cycling safety. American Journal of Preventative Medicine, 52(2), 106–112.
Noland, R. B. (2001). Relationships between highway capacity and induced vehicle travel. Transportation Research Part A: Policy and Practice, 35(1), 47–72. https://doi.org/10.1016/S0965-8564(99)00047-6
Handy, S. (2020). Is accessibility an idea whose time has finally come? Transportation Research Part D: Transport and Environment, 83, 102319. https://doi.org/10.1016/j.trd.2020.102319
Congress for the New Urbanism. (2019). Freeways without futures 2019: Candidates for removal. CNU.
Speck, J. (2018). Walkable city rules: 101 steps to making better places. Island Press.
Federal Transit Administration. (2023). Capital cost characteristics of transit projects: 2022 update. U.S. DOT.
Organisation for Economic Co-operation and Development. (2022). Transport infrastructure investment and maintenance spending: International transport forum statistics. OECD Publishing.