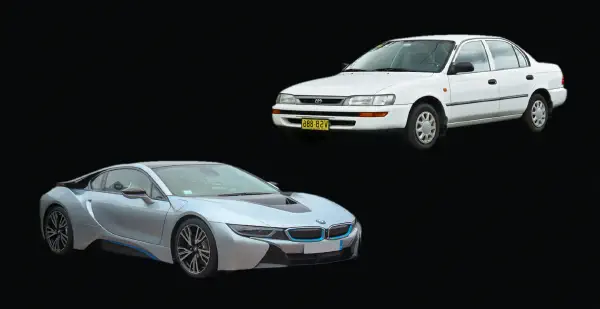
Imagine you are standing on a used‑car lot, holding the keys to two vehicles. Both are five years old. Both have around 120,000 kilometres on the clock. Both will cost you, after financing and fees, roughly the same amount of money per month. One is a Toyota Camry Hybrid, the colour of beige and compromise. The other is a BMW 330i, a car that in 2019 was praised by every automotive publication as the benchmark sport sedan, a vehicle with perfect 50:50 weight distribution, a creamy inline‑six (or turbo four, depending on the spec), and a cabin that smells of leather and ambition.
Which car should you buy?
The automotive press will give you a clear answer: the BMW. The Camry is an appliance; the BMW is a machine for driving. JD Power’s Initial Quality Survey might have given both cars similar scores three years ago, but that’s ancient history. Consumer Reports will offer a reliability rating that probably favours the Toyota, but in a generic, disembodied way — a sea of red and green dots that doesn’t convey the visceral experience of a water pump failing on the shoulder of the 405 at midnight.
Now imagine a different source of information. It is a spreadsheet maintained by a man named David, whom you met in Part 2. David runs 187 Camry Hybrids and a small number of other vehicles for rideshare drivers. He has, at his fingertips, the total cost of every unscheduled repair those cars have ever needed, the exact interval of every brake job, the fuel economy calculated from millions of kilometres of receipts, and the price every used unit fetched when it was retired. David would not consider buying a used German car for his fleet. He would not even look at one. “The purchase price is a trap,” he said. “It is the cheapest part of owning a BMW. The expensive part is the next five years.”
This chapter is about closing the gap between David’s world and yours. It is about the structural information asymmetry that leaves ordinary car buyers — people who make one of the largest financial decisions of their lives every five to ten years — relying on the automotive equivalent of astrology: magazine reviews written after a two‑hour press drive, survey scores that capture the first owner’s honeymoon, and brand reputations shaped by marketing budgets rather than mechanical endurance. It is about how the fleet operator, almost invisibly to the public, runs the only experiment that truly answers the question “what will this car cost me?” — and how you, as a buyer, can steal the answers.
The Asymmetry#
The asymmetry between a car manufacturer and a car buyer is not a matter of opinion. It is a matter of data. A manufacturer — Toyota, BMW, Tesla — knows, before the first customer delivery, what the design margins are. It knows how many thermal cycles the cooling‑system plastic was tested to survive. It knows the mean time between failure for the transmission valve body. It knows the battery’s predicted degradation curve under ideal, moderate, and abusive charging conditions. It knows all of this, and it tells the public almost none of it.
Instead, the manufacturer communicates through marketing: warranties, which are carefully calibrated to expire just before the failure‑rate curve steepens; press reviews, which test new or nearly‑new vehicles under curated conditions; and sponsored content that swarms YouTube and Instagram with warmly‑lit footage of vehicles doing things they will never do in your ownership — carving mountain roads, splashing through rivers, towing yachts.
The consumer, on the other side of this information wall, is left with a handful of proxies. The JD Power Dependability Study, which asks original owners about problems after three years — a window that captures roughly the 50,000‑kilometre mark, decades before a Camry or a BMW reveals its genuine character. The Consumer Reports reliability survey, which extends further into a vehicle’s life but is still a survey of private owners, most of whom sell their cars before 100,000 kilometres. Online owner forums, which are a cacophony of self‑selected anecdotes, heavily weighted toward the dissatisfied.
None of these sources, taken together, can tell you what will happen to the BMW’s turbocharger wastegate at 150,000 kilometres, or whether the Camry’s hybrid battery will still hold a charge at 400,000 kilometres. They are, to borrow a phrase from the statistician Nate Silver, a fog of noise dressed as a signal.
The fleet operator is the only actor in this ecosystem who systematically cuts through the fog. He does not do it out of altruism. He does it because his spreadsheet demands it.
How the Fleet Operator Closes the Gap#
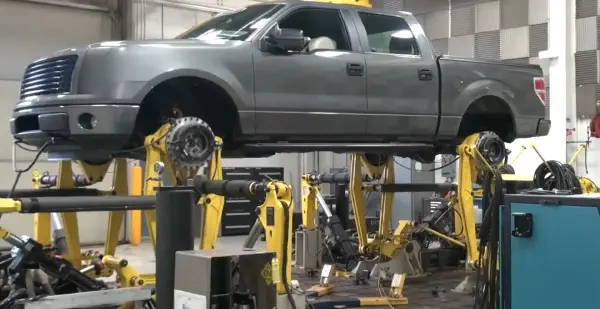
A fleet operator with 200 vehicles is effectively running a controlled trial. He buys a batch of cars, operates them under a standardised set of conditions (often the same drivers, the same routes, the same maintenance schedules), and logs every dollar they consume. After three to five years and 400,000 kilometres per vehicle, the data is not a sample. It is a population. The failure rate of a given component — say, the water pump on a 2019 BMW 330i — is no longer a theoretical probability. It is an observed frequency. The cost per kilometre is not a manufacturer’s estimate; it is an invoice total divided by an odometer reading.
When that fleet operator disposes of the vehicles at auction, the price they fetch becomes a public market signal. A 2019 Camry Hybrid with 400,000 kilometres that commands a higher auction price than a 2019 BMW 330i with 250,000 kilometres is not telling you something about styling or brand prestige. It is telling you something about the car’s remaining useful life, as evaluated by a professional buyer who is risking her own money on the assessment.
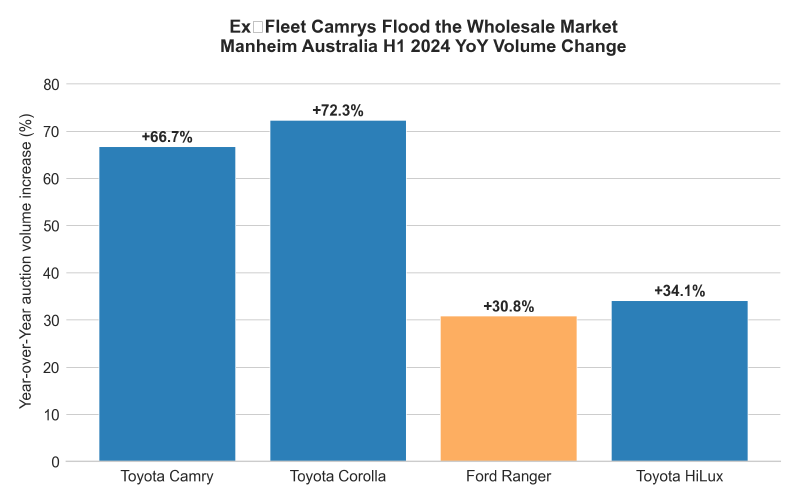
The auction data, aggregated over thousands of transactions, paints a picture of a market that has already internalised the durability lessons that the automotive press ignores. When Manheim Australia reports that Camry auction volume surged 66.7 percent in a single half‑year, that is a wave of ex‑fleet vehicles hitting the market. The fact that their prices hold up — not at stratospheric levels, but at levels that imply confidence in another 200,000 kilometres of service — is a signal that no number of JD Power awards can replicate.
The fleet operator also produces a more elementary and more powerful signal: the vehicle he chooses to buy in the first place. The hierarchy we mapped in Part 2 — Camry Hybrid at the top, Prius for value, Accord Hybrid as the only serious challenger, an echoing absence where the Germans should be — is a revealed preference that would not exist if the automotive press’s favourite cars were genuinely cheaper to run over the long term. Fleet managers are not conspiring to avoid BMWs. They are following the money. If BMWs were cheaper to run over 400,000 kilometres, they would buy BMWs. The fact that they do not, despite BMW’s aggressive fleet discounts in some markets, is the most damning review a car can receive.
What Long‑Term Cost Actually Looks Like#
Let us make the asymmetry concrete. If you were to walk into a BMW showroom tomorrow and lease a new 330i for 36 months, your total maintenance cost over that period would be near zero. The car would be covered by a comprehensive warranty and, in many markets, a pre‑paid service plan. You would be delighted. You would fill out a JD Power survey with a row of perfect scores. You would recommend the car to your friends.
If you were to buy that same BMW used, after the lease expired, and keep it for ten years, you would be looking at a cumulative maintenance bill north of $15,000 — more than two and a half times the cost for a Toyota, and significantly more than for a Lexus, which delivers a comparable luxury experience on a mechanical foundation that was designed to survive taxi duty.
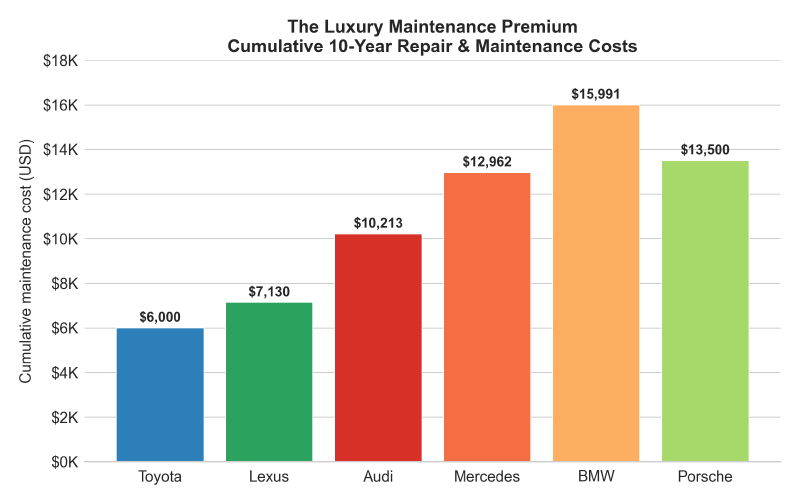
The 10‑year maintenance cost is not a theoretical projection. It is derived from real repair‑order data aggregated by platforms like CarEdge, which has built actuarial models of vehicle ownership. The chart does not care that the BMW’s steering felt sublime on a press launch. It only cares that the electric water pump failed at 85,000 kilometres, that the valve cover gasket started seeping at 110,000 kilometres, and that the driver’s‑side window motor packed up at 140,000 kilometres. Those failures do not make BMW an incompetent company. They make BMW a company that designed a car for a different owner than the one who ends up holding the title at year eight.
The major‑repair probability brings the same asymmetry into sharper, more frightening focus.
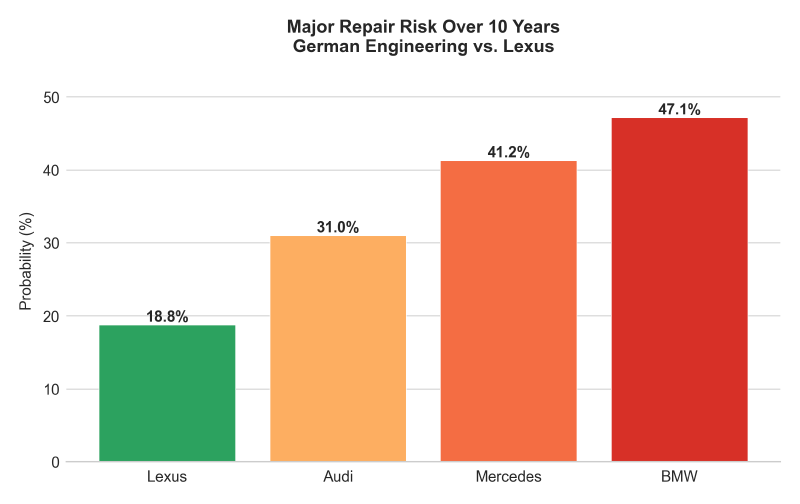
A BMW has a 47 percent chance of needing a major repair within a decade. A Lexus — which is, remember, a luxury car built by the same manufacturer that builds the 400,000‑kilometre Camry — has an 18 percent chance. Flipped around, the BMW owner is more likely than not to avoid a major repair, but the 47 percent figure means that buying a used German luxury car is a coin flip with a very expensive downside. A Camry or a Lexus is a bet on which side of the coin lands: it almost doesn’t matter.
For a household trying to budget a fixed monthly transportation cost — a household that cannot afford a $4,000 surprise when the adaptive suspension fails — the fleet‑derived reliability hierarchy is not a curiosity. It is a financial planning tool. The automotive press does not offer this tool. The fleet operator carries it in his head because he has had to.
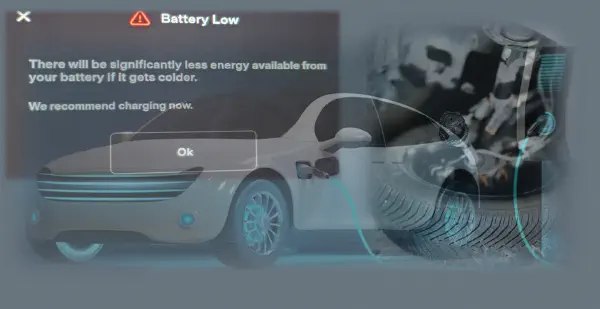
The EV Chapter: What We Know and What We Don’t#
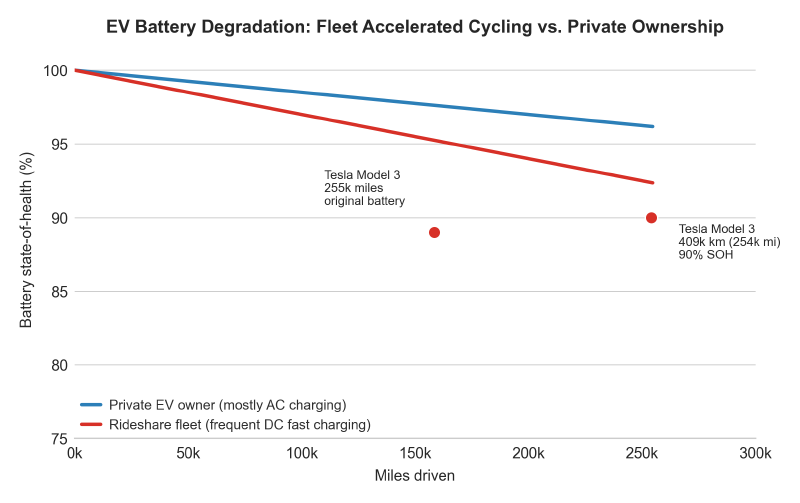
The electric vehicle sits in a frustrating middle ground. The early fleet data, as we discussed in Part 4, suggests that the electric drivetrain — the battery and motor — can be extraordinarily durable. Teslas at 400,000 kilometres with 90 percent battery state‑of‑health are not mythical creatures; they are documented, verified, and driving. The regenerative braking advantage, while less brake‑wear‑focused than Toyota’s hybrid strategy, is still real. The energy cost per kilometre, in most markets, is a fraction of the cost of gasoline.
But the data also reveals that the periphery of the electric car — the suspension components stressed by battery weight and instant torque, the door handles and touchscreens and HVAC systems that are more electronically complex than their mechanical counterparts — is failing at a rate that the Camry’s impeccably simple periphery does not. The long‑term TCO of a high‑mileage Tesla in rideshare service is not yet a solved equation. It may, in time, prove to be lower than the Camry’s, once the suspension‑wear cycle is fully understood and the secondary market for EV‑specific parts matures. Or it may spike at the 7‑year mark, when the touchscreen and the thermal‑management valves begin to fail in numbers that no recall program can muffle.
For a private buyer, the lesson is clear but uncomfortable: if you want the lowest possible risk and the most predictable long‑term cost, buy the Camry Hybrid — the vehicle the fleet data has crowned. If you want to participate in the electric future and are willing to accept some residual uncertainty, choose an EV with a battery—chemistry that has been validated in fleet conditions (the LFP‑equipped Tesla Model 3, for example) and budget for suspension and electronic repairs after year five. Do not buy an EV on the assumption that “no moving parts” means no maintenance. The fleet data is already proving that to be false.
How to Read the Market Like a Fleet Manager#
The practical takeaway from this series can be condensed into a handful of principles that any private buyer can apply, without a fleet manager’s spreadsheet and without access to proprietary auction data. They are not difficult. They are simply different from the way the car‑buying world has taught you to think.
1. Ignore the magazine reviews. They measure a car on its best behaviour, on the best roads, in its first thousand kilometres. They tell you almost nothing about what the car will be like at 200,000 kilometres. Read them for entertainment, if you must, but do not let them influence your purchase decision.
2. Ignore the JD Power Initial Quality Study. It captures rattles, infotainment glitches, and panel‑gap complaints in the first 90 days. It is a measure of factory quality control, not of long‑term durability. A vehicle can ace the IQS and be mechanically catastrophic at 150,000 kilometres. Many do.
3. Treat Consumer Reports reliability ratings as a starting point, not an endpoint. They are the best public survey available, but they are still surveys of private owners. At low to moderate mileage, they can flag problematic models; at high mileage, they become thin and unrevealing.
4. Look at fleet procurement lists. If a vehicle is the most commonly purchased car for taxi and rideshare fleets in cities around the world, that is not a coincidence. It is a verdict delivered by the most demanding durability test available. The Camry Hybrid, the Prius, and the Accord Hybrid are not the most exciting cars on the road. They are, by a wide margin, the most honest.
5. If you must buy a used German luxury car, price the maintenance risk into the purchase price. A BMW 3 Series with 120,000 kilometres is not a bargain at $18,000 if it carries a 47 percent probability of a multi‑thousand‑dollar repair within four years. Discount the price accordingly, or buy a Lexus with the same luxury character and half the risk.
6. Wait for the EV fleet data to mature before committing to a high‑mileage used EV. Carlos’s Model 3 at 410,000 kilometres with 90 percent battery health is an encouraging signal, but it is one signal. Until there are hundreds of such data points, and until the auction market has priced them, a used EV with over 150,000 kilometres is a speculation, not a calculated purchase. If you buy new, charge gently, and plan to keep the car for a decade, the fleet data suggests you will probably be rewarded — but the car’s electronics and suspension will be the variables to watch.
The Structural Argument#
The series you have just read rests on a single structural claim: that the automotive market is characterised by a profound information asymmetry, and that the fleet operator — alone among the actors in this market — systematically resolves it. The fleet operator does this not because he is smarter than the rest of us, but because his incentives are aligned with the truth. He cannot afford to be seduced by a glowing review or a soft‑touch dashboard. He has to pay the repair bills.
The private buyer can, with modest effort, steal the fleet operator’s lens. The data is public, or public‑enough. The auction reports are published. The fleet‑operator interviews are published in trade magazines that anyone can access — Fleet Owner, Automotive Fleet, Gridwise. The maintenance‑cost databases exist. The hierarchy is visible to anyone who looks in the right place.
The tragedy is that almost no one looks. The automotive press directs our gaze toward the new, the fast, and the beautiful — and away from the taxi rank where a 500,000‑kilometre Camry is quietly idling, still on its original water pump. The manufacturer’s marketing budget ensures that every television commercial, every YouTube pre‑roll, every glossy brochure shows a car ascending a coastal highway at dawn, not a car sitting in a service bay with its dashboard disassembled.
The fleet operator sees the service bay. He knows its costs intimately. And he has voted, with hundreds of thousands of fleet‑procurement dollars, for the vehicles that spend the least time there.
The question, reader, is whether you will vote the same way.
End of series.
“The Mileage Machine” was reported from auction lanes, fleet‑office spreadsheets, driver forums, and the raw telemetry of vehicles that have outlived their press releases. The data, as always, is available to anyone who asks the right question.