In a nondescript office park outside Phoenix, Arizona, a fleet manager named David — he asks that his last name and his company not be used, because Toyota is a client and he prefers not to attract attention — opens a spreadsheet. It contains five years of data on 187 Toyota Camry Hybrids, 22 Honda Accord Hybrids, and a smattering of other sedans that have cycled through his operation, which supplies vehicles to Uber and Lyft drivers on a lease‑to‑own basis.
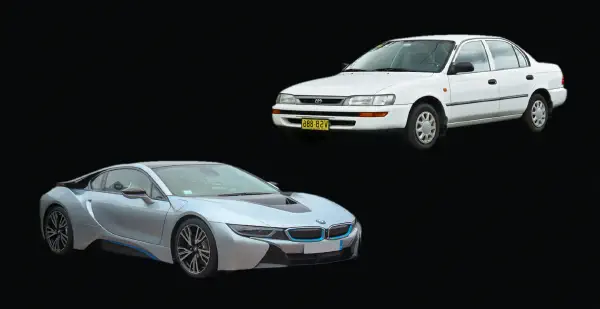
The spreadsheet tells a story so unambiguous that David can summarise it without looking at the screen: “The Camry costs me $0.31 per mile, all in. The next best thing — the Accord — costs me $0.34. A Chevy Malibu, if I could still get them, would be over $0.40. And I wouldn’t touch a German car with someone else’s wallet. I tried a batch of used BMW 3 Series once because the auction prices were so low. They were cheap to buy. They were ruinous to run. Every single one of them had a four‑figure repair by 80,000 miles.”
He closes the spreadsheet. “The drivers fight over the Camrys. I can’t keep them on the lot.”
This preference is not unique to David’s operation. It is the revealed preference of an entire industry of rational actors — the fleet operators, rideshare drivers, and taxi company owners who collectively run the largest uncontrolled durability experiment in the world. Their verdict, recorded in maintenance invoices and auction prices and driver forums, is remarkably consistent: the Toyota Camry Hybrid is the benchmark. The Toyota Prius is the budget alternative. The Honda Accord Hybrid is the respectable challenger. Everything else — and especially everything German — lives in a different, much more expensive universe.
The TCO Lens#
To understand the fleet hierarchy, one must first understand the lens through which fleet operators see a vehicle. It is not the lens of a car enthusiast. It is not even the lens of a typical private owner, who makes emotional trade‑offs between fuel economy and styling and badge prestige. The fleet lens is total cost of ownership — TCO, the cold arithmetic of every dollar a vehicle will consume from acquisition to disposal, divided by the number of kilometres it will travel.
TCO has four principal components: the cost of acquisition (purchase price, financing, depreciation); the cost of fuel or energy; the cost of scheduled and unscheduled maintenance; and the residual value at disposal. For a fleet operator, these four numbers are not guesses. They are tracked to the cent and updated quarterly. Any vehicle that underperforms on any of them is removed from the approved list.
When you apply the TCO lens to the rideshare duty cycle — 70,000 to 110,000 kilometres per year of predominantly urban driving, with frequent stops and starts, passengers of wildly varying respect for the interior, and a driver who is financially incentivized to maximise on‑road time and minimise shop visits — certain vehicles rise to the top with the force of a physical law. Others sink. The sinking is what makes this story interesting.
The Benchmark: Toyota Camry Hybrid#
The Toyota Camry Hybrid is not an exciting car. Its 2.5‑litre four‑cylinder engine, running on the Atkinson cycle, produces a combined 208 horsepower and propels the vehicle from 0 to 60 miles per hour in a leisurely 7.4 seconds. Its continuously variable transmission — a planetary gearset, in Toyota’s hybrid system, not a belt‑and‑cone design — feels strange to drivers accustomed to stepped gears. Its exterior styling is inoffensive. Its interior is comfortable but unremarkable. Car and Driver describes it as “a transportation appliance of the highest order,” and they mean it as a compliment.
For a fleet operator, every one of those sentences is a selling point.
The Camry Hybrid’s mechanical architecture is built around the Toyota Hybrid System II — THS‑II — which has now been in production for more than two decades. The system’s defining characteristic is a power‑split device that functions as a continuously variable transmission using a planetary gearset, with two electric motor‑generators and the gasoline engine permanently meshed together. There are no clutch packs to wear out, no belts to slip, no torque converter to overheat in stop‑and‑go traffic. The transmission is, for all practical purposes, indestructible under normal operating conditions — and the fleet duty cycle qualifies as normal.
The Regenerative Braking Advantage#
In an urban rideshare vehicle, the brakes are the first and most predictable failure point. A conventional gasoline sedan, driven hard in city traffic, will consume a set of front brake pads every 30,000 kilometres. Rear pads last twice as long, but the front‑axle brakes — where most of the stopping force is concentrated — are a recurring maintenance cost and a fleet downtime headache.
In the Camry Hybrid, regenerative braking changes the equation entirely. The electric motor‑generator reverses torque during deceleration, converting the vehicle’s kinetic energy into electricity and storing it in the hybrid battery. The friction brakes engage only at low speeds and during hard stops. The result, documented in fleet maintenance records across three continents, is a brake‑pad replacement interval that extends to 150,000 kilometres and beyond.
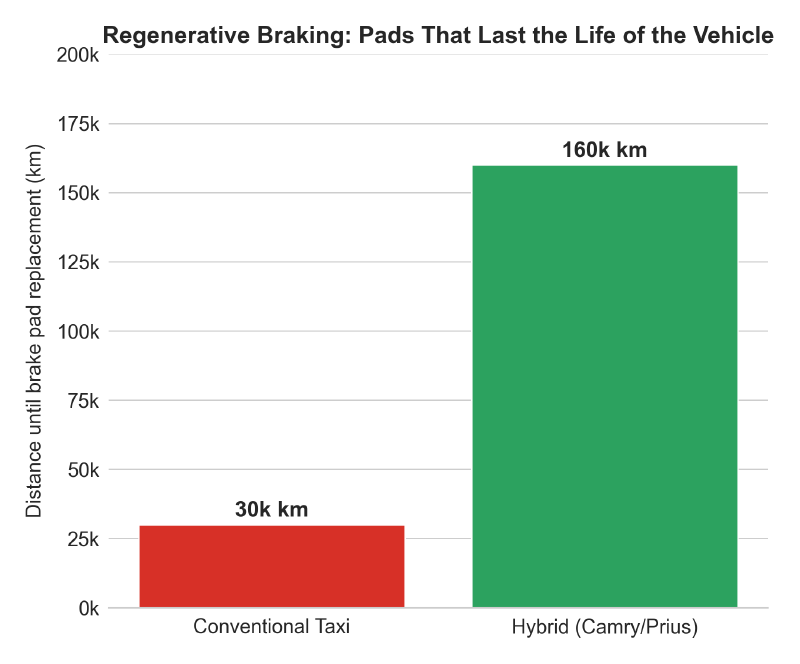
This is not a marginal improvement. It is a categorical difference. Over a 500,000‑kilometre operating life, a conventional taxi will require 12 or more front‑brake‑pad replacements. The Camry Hybrid requires three. The savings are not just in parts — the pads themselves are inexpensive — but in labour, downtime, and lost driver income. A rideshare driver whose car is in the shop for brake work is a driver who is not earning money, and the cost of that lost time dwarfs the cost of the pads. David, the fleet manager, puts it bluntly: “A brake job costs me $300 in parts and labour. A day off the road costs my driver $200 in lost fares. I’ve eliminated nine brake jobs in the life of the vehicle. That’s $4,500 in direct savings, minimum.”
The Atkinson Engine#
The Camry Hybrid’s 2.5‑litre engine operates on the Atkinson cycle, a thermodynamic trick that leaves the intake valve open for part of the compression stroke, effectively reducing the compression ratio after the piston has done its work. The result is an engine that extracts more mechanical energy from each unit of fuel at the expense of peak power — a trade‑off that is ideal for a hybrid, where the electric motor can fill in the torque gaps during hard acceleration.
Toyota’s engineering team has pushed the thermal efficiency of this engine above 40 percent, a number that was unthinkable for a production gasoline engine two decades ago. A conventional Otto‑cycle engine in the same displacement class runs at 25 to 30 percent thermal efficiency under partial load — and partial load is precisely what urban driving demands. The practical outcome is that the Camry Hybrid returns 5.0 litres per 100 kilometres (51 miles per gallon) in real‑world fleet operation, according to the fleet‑management platform Gridwise. In stop‑start taxi duty, the fuel savings relative to a conventional midsize sedan compound rapidly.
The Battery That Won’t Die#
Toyota’s hybrid battery management is conservative to the point of paranoia. The nickel‑metal hydride (or lithium‑ion, in newer models) battery pack is never fully charged and never fully discharged. It cycles between 40 and 60 percent state of charge, staying in the gentle middle region where degradation is slowest. This is the opposite of the way a consumer uses a smartphone, and it is the reason that Toyota hybrid batteries routinely outlast the vehicles they are installed in.
When the Dubai Camry that has covered 853,000 kilometres finally gets its battery pack inspected, the technician finds that the individual cell voltages are still within specification. The battery has degraded, but it has not failed. It is still delivering enough power to assist the gasoline engine and absorb regenerative braking energy. Its effective lifespan, under this duty cycle, appears to be longer than the mechanical lifespan of the engine — and the engine’s lifespan, as the 500,000‑plus examples demonstrate, exceeds the typical service life of a fleet vehicle.
The Auction Evidence#
The market knows what the market knows. When ex‑fleet Camry Hybrids arrive at wholesale auctions, they command prices that reflect their reputation. In the first half of 2024, Manheim Australia reported a 66.7 percent year‑on‑year increase in Camry auction volume — a surge driven by the disposal of thousands of rideshare units. The Corolla Hybrid saw a 72.3 percent increase. These vehicles flooded the market, and yet their price index remained resilient relative to the overall used‑car market, which was cooling from its pandemic peak. Buyers at those auctions — independent used‑car dealers who have no loyalty to Toyota and who are risking their own capital — are voting with their wallets for a vehicle that has already delivered half a million kilometres. They know what comes next: another 200,000 kilometres, probably without major incident.
The Challenger: Toyota Prius#
If the Camry Hybrid is the fleet operator’s standard bearer, the Toyota Prius is the value pick. The Prius uses the same THS‑II architecture in a smaller, lighter, and even more aerodynamic package. Its real‑world fuel economy in rideshare service touches 54 miles per gallon (4.3 L/100 km). Its brake‑pad replacement intervals are comparable to the Camry’s, because the regenerative‑braking physics are identical. Its interior is smaller and less comfortable for passengers, which limits its appeal for Uber Comfort or Lyft Lux tiers, but for the standard UberX or Lyft ride, it is a machine of brutal efficiency.
The Prius also benefits from being cheap to acquire on the used market. At a typical wholesale auction, a five‑year‑old Prius with 200,000 kilometres will sell for a price that makes the TCO arithmetic irresistible. Fleet operators who lease vehicles to rideshare drivers report that the Prius is the vehicle of choice for drivers who are buying their own car and who view every dollar of upfront cost as a dollar that must be earned back in fares. The Prius’s interior plastics will rattle after 300,000 kilometres; the seats will sag; the paint will fade. But the drivetrain will keep running.
The Respectable Alternative: Honda Accord Hybrid#
The Honda Accord Hybrid is the only vehicle that consistently appears alongside the Camry in fleet procurement analyses, and even then, it places a firm second. Honda’s hybrid system is mechanically different from Toyota’s — it uses a clutch‑based system that can lock the gasoline engine directly to the wheels at highway speeds, which improves efficiency under those conditions. In urban stop‑start duty, however, the Accord’s advantage disappears, and its overall TCO comes out slightly higher. Fleet data published by Automotive Fleet magazine estimates a five‑year TCO of $37,216 for the Accord Hybrid versus $33,247 for the Camry Hybrid, based on 12,000 miles per year for a new vehicle. Extrapolate those numbers to rideshare mileage, and the gap widens to thousands of dollars per year.
The Accord Hybrid’s real disadvantage, however, is not in its fuel economy or its maintenance schedule. It is in its market presence. Toyota’s hybrid‑production capacity dwarfs Honda’s, which means the Camry is cheaper to buy in bulk and easier to source on the used market. Fleet operators gravitate to the vehicle they can acquire in quantity, and the Camry’s availability advantage reinforces its dominance.
The Missing Contenders#
It is instructive to note which vehicles do not appear in the fleet hierarchy. American sedans — the Chevrolet Malibu, the Ford Fusion — have been discontinued. Korean hybrids — the Hyundai Sonata Hybrid, the Kia K5 Hybrid — are competent vehicles with competitive TCO on paper, but they lack the multi‑decade track record of high‑mileage fleet performance that fleet managers prize. Fleet procurement is risk‑averse: a fleet manager who bets on an unproven platform and gets burned will lose their job. A fleet manager who buys 200 Camrys and sees them all reach 500,000 kilometres will be promoted.
And then there are the Germans.
The German Problem (Preview)#
This will be the subject of Part 3 in detail, but the fleet data is so stark that it demands a preview here. The vehicles that dominate the consumer-satisfaction surveys — BMW, Mercedes‑Benz, Audi — are the vehicles that fleet operators avoid. The reason is not snobbery or ignorance. It is the maintenance cost curve.
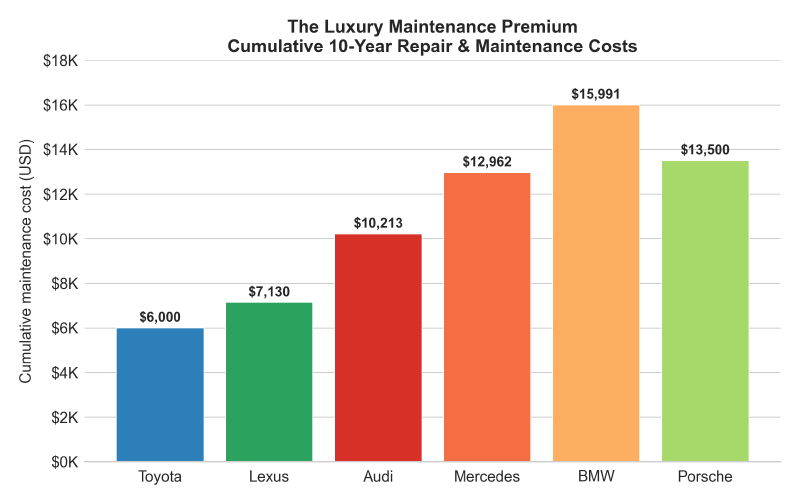
CarEdge, a data platform that aggregates vehicle ownership costs, estimates that a BMW will cost $15,991 in cumulative maintenance and repairs over 10 years, compared to $6,000 for a Toyota. A Mercedes‑Benz will cost $12,962, an Audi $10,213, a Porsche between $11,000 and $16,000. Lexus — Toyota’s luxury division — manages $7,130, less than half of the cheapest German marque.
The major repair probability tells the same story in a different register:
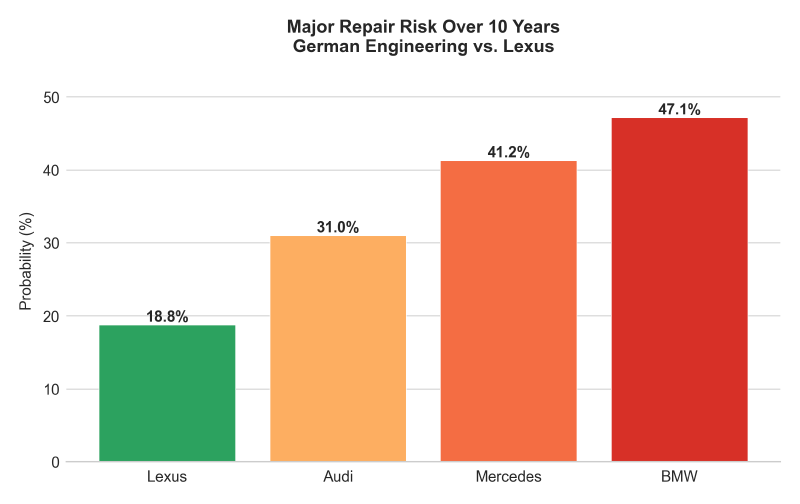
A Lexus has an 18.75 percent probability of requiring a major repair within 10 years. An Audi: 30.97 percent. A Mercedes: 41.24 percent. A BMW: 47.11 percent. These are not small differences. A BMW owner is roughly two and a half times more likely to face a major repair than a Lexus owner — and in the fleet context, where vehicles are driven three or four times the annual distance of a private owner, the probability curve steepens dramatically.
When a fleet operator looks at these numbers, they do not see “German engineering.” They see unscheduled downtime, mechanic bills that eat into margins, and vehicles that must be retired before they have earned back their acquisition cost. A BMW 3 Series that costs $15,000 at auction with 100,000 kilometres on the clock looks like a bargain. It is, in fact, the most expensive car on the lot.
Why the Hierarchy Persists#
The fleet hierarchy is stable because it is, in a sense, a natural phenomenon. Toyota’s product-development culture — the long cycle, the conservative validation, the incremental improvement — produces vehicles that are optimised for a world of high utilisation and low drama. The TNGA platform, which underpins the current Camry, was designed with lessons learned from millions of fleet vehicle‑years. The brake‑wear advantage, the battery‑management strategy, the decision to use a planetary gearset rather than a belt‑CVT — these are not accidents. They are the product of an engineering philosophy that prioritises the 10th owner as much as the first.
German manufacturers, by contrast, optimise for a different world. The German premium model is built around the 3‑year corporate lease, a market structure that does not exist at the same scale in Japan or the United States. A vehicle that will be returned to the manufacturer after 36 months and resold as a certified pre‑owned unit needs to perform flawlessly for those 36 months. It does not need to reach 400,000 kilometres without a major failure. The design margins are set accordingly. Part 3 will explore these structural incentives in detail.
The Rational Buyer’s Conclusion#
If you are a private buyer reading this, you may be tempted to dismiss fleet data as irrelevant. “I don’t drive Uber,” you might say. “I don’t put 100,000 kilometres a year on my car. Why should I care what happens to a Camry at 500,000 kilometres?”
The answer is that fleet data reveals the genuine engineering margin — and that margin benefits every owner, regardless of how they use the car. A vehicle that can survive 500,000 kilometres of rideshare abuse will, in private hands, deliver a decade or more of near‑zero-problem ownership. A vehicle that fails the fleet test after 80,000 kilometres will, sooner or later, fail the private owner too — it will simply do so after the warranty expires and after the glowing magazine reviews have faded from memory.
The fleet hierarchy is not an elite secret. It is public information, hiding in auction reports and fleet‑operator interviews and trade‑publication articles that the mainstream automotive press never reads. The next two parts of this series will expand on what this hierarchy reveals: first, the German failure, and then the new frontier of electric vehicles, where the same accelerated lifecycle is generating the first genuine durability signals. The data, as you will see, does not flatter the industry’s most expensive marques.
Coming in Part 3: The German Problem — Why the world’s most admired luxury brands fail the only durability test that matters, and how the 3‑year lease cycle corrupted automotive engineering.