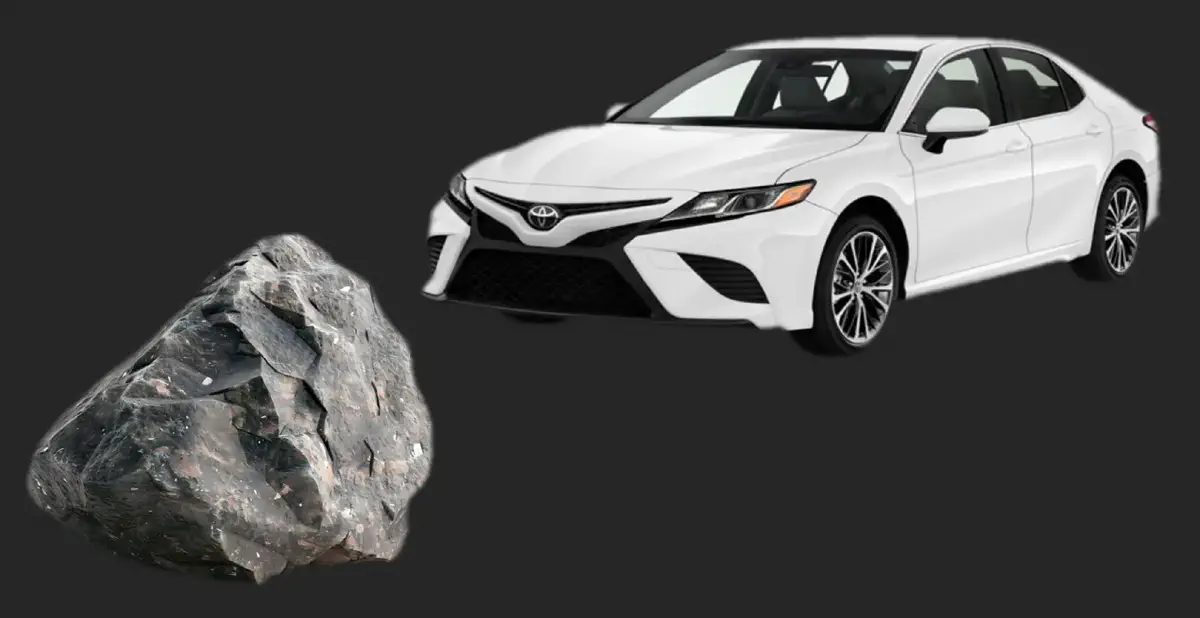
In a Dubai garage that never closes, a white 2018 Toyota Camry Hybrid has just rolled past 853,000 kilometres. The odometer — the car’s 12th oil change, its 15th set of tires, its 2,800th passenger pickup — is still climbing. Nothing in the powertrain has been replaced. The brake pads were swapped at 200,000 kilometres, then again at 420,000, and then once more at 640,000. The battery pack, which Toyota suggests might need attention at some point in the vehicle’s second decade, hums along as if it were still on the showroom floor. The car has, effectively, compressed three lifetimes of private ownership into five years of 24‑hour shift‑work, and the only things that have broken are the things that always break: interior trim, a window regulator, a seat adjustment motor.
This Camry is not an outlier. If you visit the used‑vehicle auctions in Sharjah or Al Aweer, you will find whole rows of them, odometers clustered in the 400,000‑to‑700,000‑kilometre band, all wearing the livery of Careem or Uber or the Dubai Taxi Corporation. They have been driven not by a single owner who garaged them on weekends and changed the oil every 5,000 miles out of an abundance of love, but by a rotating cast of drivers who treat the accelerator pedal as a binary switch and whose only interaction with the service schedule is the warning light on the dash. And yet they survive.
This reality — a secret hiding in plain sight — is the starting point for a different way of understanding cars. It is a dataset that the automotive industry systematically ignores, but which contains more truth about what a vehicle is actually worth than any magazine comparison test, any JD Power survey, or any manufacturer’s claims of “legendary reliability.”
The Controlled Lie#
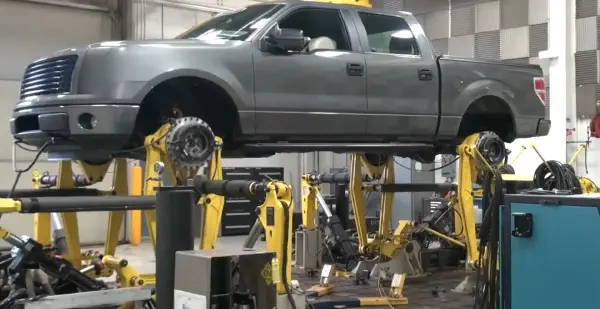
The automotive industry’s standard method for proving a vehicle’s durability is a proving ground. Every major manufacturer operates one: Toyota has its Higashi‑Fuji Technical Center and the Shibetsu Proving Ground; Hyundai runs the mammoth Namyang facility; GM has its Milford Proving Ground in Michigan. These are closed circuits, privately policed, where prototype vehicles can be flogged around a high‑speed bowl or driven over Belgian‑block pavé until something breaks.
The problem is not that these tests are useless. They reveal plenty — suspension bushing life, engine mount fatigue, the mean time between failure for a coolant hose under repeated thermal cycling. The problem is that they are, by their very nature, sanitised. The test driver is a professional who follows a protocol. The ambient temperature is recorded but rarely extreme for long. The “customer‑correlated” drive cycles — the stop‑start traffic simulations, the pothole impacts, the repeated full‑throttle merges — are approximations, not reality. A proving ground can run a car for 200,000 kilometres in six months, but it cannot replicate the chaos of a Mumbai monsoon, the corrosive salt of a Chicago winter, or the fact that a real Uber driver will ignore a grinding noise for three weeks because stopping means losing income.
This is not a conspiracy. It is a necessity. Manufacturers must test vehicles before they go on sale, and they must do it quickly. The alternative — waiting five years to see how the car fares in the real world — is commercially impossible. The result, however, is a systematic gap between the durability claims printed in the brochure and the durability that emerges when a vehicle is subjected to genuine, unscripted abuse.
The Revealed Truth#
That gap is filled by an unwitting research laboratory: the global fleet of vehicles that are driven for a living. Taxis, rideshare vehicles, courier vans, police cruisers, rental cars. These vehicles share a defining characteristic: they accumulate distance at a rate that simply does not exist in the private‑owner universe.
The difference is not marginal; it is exponential.
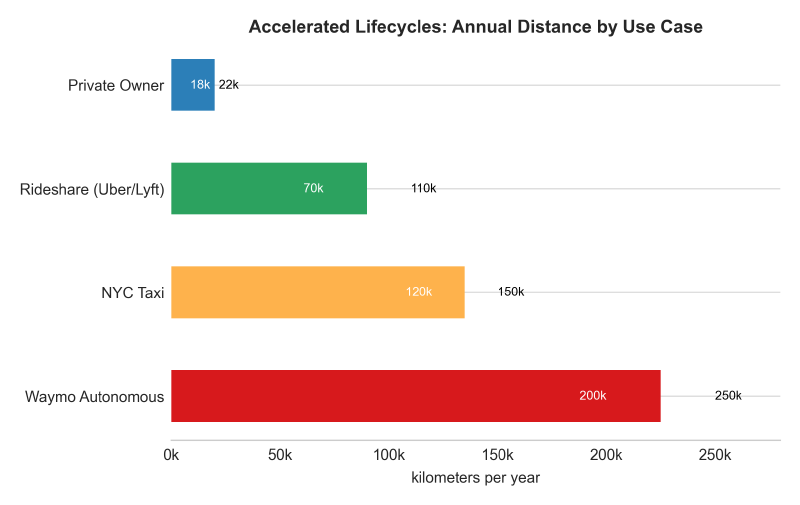
A private owner in the United States drives roughly 18,000 to 22,000 kilometres per year. That figure has been stable for decades. At that rate, it takes eight to ten years to reach 160,000 kilometres, at which point most private owners have already traded the vehicle in. The typical used‑car buyer never sees a vehicle with more than 200,000 kilometres on the clock — and when they do, they regard it as a ticking time bomb, priced accordingly.
A rideshare driver, by contrast, will put 70,000 to 110,000 kilometres on a vehicle in a single year. A New York City yellow cab, running two 12‑hour shifts seven days a week, can reach 150,000 kilometres before its third birthday. The Dubai taxi fleet is even more extreme — vehicles routinely exceed 500,000 kilometres in under five years. The Waymo autonomous fleet in Phoenix, operating with 98.4‑percent uptime, accumulates the equivalent of over 250,000 kilometres per vehicle annually, all of it with a continuous sensor and compute load that private EVs will never experience.
This compression is the central methodological insight of this series: something happens to a machine when it crosses 300,000 kilometres in 36 months that does not happen when it crosses the same distance in 15 years. Thermal cycles are more frequent; oil‑change intervals are shorter in calendar time; components that corrode with age are actually less corroded; but components that wear with mechanical friction — bearings, cylinder bores, transmission clutch packs — are subjected to a concentrated assault. The failure modes that emerge are not the same ones that appear in a Consumer Reports survey of three‑year‑old vehicles with 50,000 kilometres. They are the failure modes that reveal the genuine engineering margin — or lack of it.
The Fleet Data Ecosystem#
Fleet operators do not form opinions about cars. They form spreadsheets. A fleet manager with 200 Camrys does not care about the soft‑touch dashboard plastic or the “emotion” of the steering feel. They care about three numbers: fuel cost per kilometre, maintenance cost per kilometre, and resale value at the end of the service life. Anything else — badge prestige, magazine review scores, 0‑60 times — is noise.
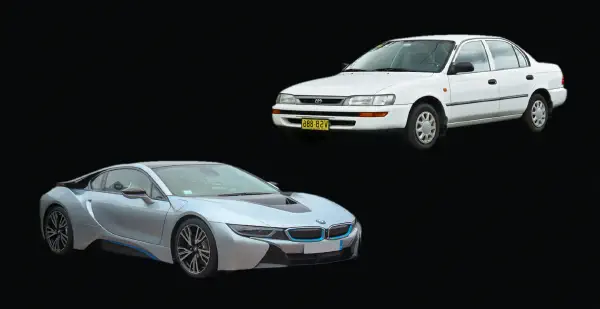
This focus makes fleet procurement the closest thing the automotive industry has to revealed preference under rational conditions. When a fleet operator chooses a Toyota Camry Hybrid over a BMW 3 Series or a Mercedes C‑Class, they are not expressing a lack of imagination. They are expressing the output of a total‑cost‑of‑ownership model that has been refined over thousands of vehicle‑years of data.
The data that feeds that model is extraordinarily rich. Maintenance records are centralised and timestamped. Fuel purchases are tracked to the litre. Downtime is logged and assigned a cost. At disposition, the auction sale price is recorded with full disclosure of the vehicle’s history. Multiply that by 200 vehicles and five years, and you have a dataset that a single private owner — or even JD Power’s survey of 80,000 owners — cannot hope to match in granularity.
For journalists, the tragedy is that most of this data is invisible to the public. But not all of it. Fleet vehicles, after their service life ends, are disposed of at wholesale auctions, and those auction houses publish aggregate data. Manheim, the world’s largest vehicle auction company, reports on volume, pricing, and vehicle mix. Black Book tracks residual values. And in major cities, taxi and limousine commissions keep public records of their fleets — New York City’s Taxi and Limousine Commission database, for example, contains over 80,000 vehicle‑years of operational data, including vehicle type, mileage, inspections, and retirements.
The Auction Yard as Laboratory#
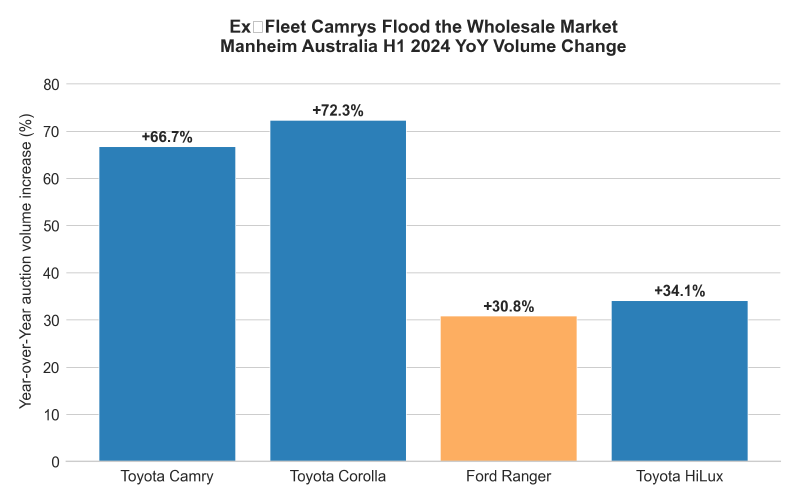
The volume of ex‑fleet vehicles entering the wholesale market is itself a signal. Consider the most recent data from Manheim Australia: in the first half of 2024, the volume of Toyota Camry units sold at auction rose 66.7 percent year‑on‑year. Corolla volume was up 72.3 percent. These are not random fluctuations — they reflect the end of a fleet replacement cycle, as thousands of rideshare and rental vehicles that were purchased during the pandemic’s supply‑chain chaos are now being turned over.
When those Camrys cross the auction block, they arrive with odometer readings that would make a private buyer flinch — 300,000, 400,000, 500,000 kilometres — and yet they sell. Not at the fire‑sale prices that a consumer might expect for a “high‑mileage” car, but at prices that reflect the market’s hard‑earned knowledge: a well‑maintained Camry Hybrid with 400,000 kilometres on the clock is, in many respects, less mechanically risky than a German luxury sedan with 120,000 kilometres. The auction data, examined over time, reveals a durability hierarchy that is entirely invisible in consumer satisfaction surveys.
This is the hierarchy that Part 2 of this series will map in detail. But the foundational point — the reason this data matters — is that it is not an opinion. It is a price signal. In a market where buyers are professionals whose livelihoods depend on their ability to assess risk, the price a vehicle commands at auction after five years and 400,000 kilometres is the most honest durability rating ever assigned.
What the Consumer Surveys Miss#
The leading public‑facing arbiter of automotive quality in the United States is the JD Power Initial Quality Study and its companion Vehicle Dependability Study. These surveys ask owners to report problems experienced in the first 90 days (for IQS) or the first three years (for VDS). Consumer Reports runs its own annual reliability survey, which reaches back further — sometimes up to 10 years — but still relies on owner self‑reporting.
These surveys produce results that are internally consistent and, within their domain, useful. If you want to know how often a brand’s infotainment system freezes in the first six months, JD Power will tell you. If you want to know whether a given model’s transmission is prone to failure by year five, Consumer Reports’ data is directionally valuable.
But for the question that matters most — what breaks when the vehicle is driven 400,000 kilometres in four years? — these surveys are silent. They are silent not because the data does not exist, but because the population of vehicles that have been subjected to those conditions is not captured. The average private owner does not cross 200,000 kilometres. When they do, they are rarely filling out a survey. Their car is either in the scrapyard, on a used‑car lot in another state, or — and this is the crucial point — they are not the kind of owner who subscribes to Consumer Reports.
The fleet vehicle, however, does not disappear into a private garage. Its entire life is documented. Every oil change, every brake job, every unscheduled repair is recorded in a fleet management system. And at the end of its service life, it is sold at auction with a condition report that a professional buyer can inspect. The data is imperfect — auction condition reports are not engineering teardowns — but it is vastly more complete than anything the consumer surveys provide for vehicles at extreme mileage.
The Rational Operator#
There is a second, subtler reason why fleet data is superior: the incentive structure of the operator. A private owner’s relationship with a vehicle is emotional, aesthetic, and social. They will tolerate a car that costs more to maintain than it should because they like the way it looks, because their neighbour has one, or because the dealer is conveniently located. They will defend their purchase decision to friends and on internet forums, introducing a powerful selection bias into any survey that asks “would you buy this car again?”
A fleet manager does not have this luxury. If a particular model begins to show a pattern of transmission failures at 180,000 kilometres — a failure mode that a private owner might never encounter — the fleet manager will see it in the data within months. They will stop buying that model. They will accelerate the disposal of existing units. And they will tell their colleagues at other fleet operations, creating a word‑of‑mouth network that operates entirely outside the consumer automotive press.
This is why the fleet hierarchy looks so different from the hierarchy that appears in magazine comparison tests. The vehicles that dominate fleet procurement — Toyota Camry Hybrid, Toyota Prius, Honda Accord Hybrid — are the ones the automotive press consistently describes as “appliance‑like” or “soulless.” The vehicles that win comparison tests and generate enthusiast excitement — German sport sedans, high‑performance SUVs — are almost entirely absent from fleet procurement lists. Not because fleet managers are philistines, but because their data tells them that those vehicles will destroy their maintenance budget over a 400,000‑kilometre operating period.
The Automotive Press’s Blind Spot#
The automotive media is not, on the whole, hostile to facts. It is structurally incapable of reporting on this one. The reasons are worth examining, because they explain why the series you are reading — and the data it presents — is so unusual.
First, the automotive press is funded by advertising from the very manufacturers whose products it reviews. This does not mean that journalists are corrupt or that reviews are bought — but it does mean that the editorial environment is one in which the industry’s preferred narrative (“continuous improvement,” “exciting new technology,” “class‑leading”) is the water in which the fish swims. A story that concludes, “the Toyota Camry Hybrid is mechanically superior to your entire product line, as demonstrated by 500,000 kilometres of fleet data,” is not a story that sells luxury car advertising.
Second, the automotive press is structured around the new‑vehicle launch cycle. Journalists fly to international press events, drive a pre‑production prototype for two hours on a curated route, and file a review. The vehicle’s long‑term durability is, at best, a footnote. When outlets do run long‑term test fleets, they typically keep vehicles for 40,000 or 50,000 kilometres — far short of the point where the genuine failure modes emerge.
Third, the automotive press has an enthusiast bias. Its writers are people who love cars, which means they love the things that make cars interesting: speed, styling, technological novelty. A Camry Hybrid does not stir the soul. It is quiet, efficient, and relentless. It is the cockroach of the automotive kingdom — it will survive anything, and that very survivability makes it uninteresting to people whose professional identity is built on the idea that cars are exciting.
The result is that the most important durability information in the industry — the information that a rational buyer should weigh most heavily — is systematically under‑reported. It is left to the fleet operators, the auction houses, and a handful of academic researchers to assemble the picture that the press will not draw.
What This Series Will Do#
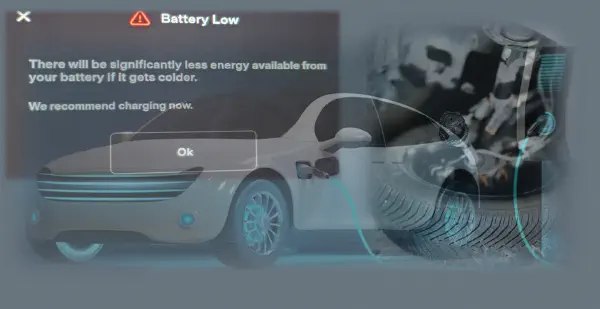
Over the next four parts, we will fill that gap. We will present, with full sourcing, what the fleet data actually shows about which vehicles survive accelerated operation and which do not. We will explain why the “boring” Japanese sedans dominate at high mileage and why German luxury brands — for all their engineering sophistication — fail the fleet test. We will examine the new frontier: electric vehicles, where the same accelerated lifecycle is generating the first reliable empirical data on battery degradation and non‑drivetrain failure. And we will conclude with a practical guide for buyers who want to use this information — the information that fleet managers already have — to make smarter purchase decisions.
The core argument is simple: if you want to know how long a car will really last, don’t read the magazine reviews. Don’t look at the JD Power scores. Look at what the people who drive for a living — and who have no one to impress — are actually buying. They have already done the experiment.
Coming in Part 2: The Revealed Hierarchy — What 300,000 kilometres actually does to specific platforms, and why the Camry Hybrid is the benchmark that no one in the industry wants to talk about.