Beneath the sun-baked salt flats of Chile’s Atacama Desert, brine rich in lithium is pumped into vast, polychrome evaporation ponds. Over 18 months, the water slowly vanishes into the arid air, leaving behind a concentrate that will embark on a global journey. It will be shipped to China for chemical conversion, then to a cathode factory, then to a gigafactory in the American South, where it will be assembled into a battery pack and installed in a sleek electric SUV. This vehicle will be sold as a “zero-emission” marvel. But its journey began with a substantial, and often omitted, carbon debt—a debt buried in the very ground it is meant to save.
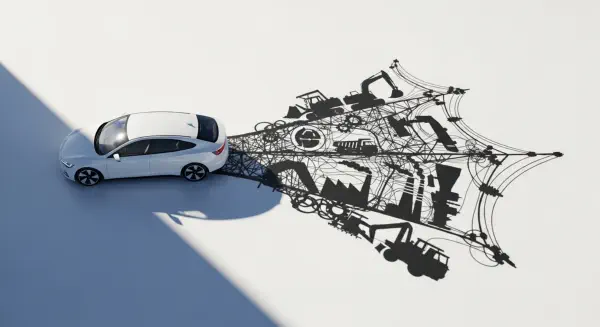
This is the central paradox of the electric vehicle transition: to secure a future of cleaner operation, we must accept a large, upfront environmental burden. The lithium-ion battery pack is the nexus of this bargain. Its production is an industrial saga of staggering complexity and energy intensity, responsible for 30-50% of an EV’s total cradle-to-grave greenhouse gas emissions. To evaluate the EV’s ledger honestly, we must conduct a forensic audit of its battery. This audit moves beyond cheerleading or skepticism, revealing a variable equation where the outcome—net environmental benefit—depends overwhelmingly on how and where this battery is born.
The carbon debt has two primary sources: the embodied emissions from mining and refining critical minerals, and the industrial emissions from the energy-intensive cell manufacturing process. Together, they create a carbon backpack that can range from 4 to 11 tons of CO2 for a typical 75 kWh battery. This debt must be “paid off” over tens of thousands of miles of driving cleaner than the gasoline alternative. Where that break-even point falls—at 15,000 miles or 70,000 miles—is the most critical calculation in the EV’s lifecycle ledger.
The Mineral Toll: From Ore to Cathode#
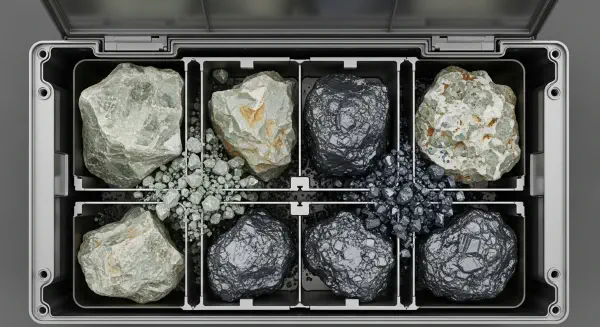
The modern NMC (Nickel-Manganese-Cobalt) battery is a precise recipe of geopolitically charged elements. A 75 kWh pack contains roughly 8-12 kg of lithium, 35-50 kg of nickel, 10-15 kg of manganese, and 5-10 kg of cobalt. Each carries an environmental and energetic passport stamped by its origin.
Lithium from brine, as in the Atacama, is water-intensive, consuming up to 2 million liters per ton of lithium carbonate in one of the planet’s driest regions. The subsequent thermal conversion to battery-grade lithium hydroxide is profoundly energy-hungry. Nickel presents a carbon cliff. As high-grade sulfide ores deplete, the industry turns to laterite ores processed via High-Pressure Acid Leaching (HPAL). In Indonesia, the world’s largest nickel producer, this process powered by coal-fired electricity can emit over 20 tons of CO2 per ton of nickel. Cobalt refining is predominantly concentrated in China, imprinting the carbon footprint of a coal-heavy grid onto the final metal.
The geopolitical dimension is inseparable from the carbon one. Over 70% of cobalt is sourced from the Democratic Republic of Congo, a supply chain fraught with ethical concerns. China controls approximately 60% of global lithium refining and 75% of cobalt refining. This concentration means the carbon intensity of a battery mineral is often a direct function of national industrial and energy policy, a variable largely outside an automaker’s—or consumer’s—immediate control.
The Gigafactory Gauntlet#
Once refined, these materials undergo their most carbon-intensive transformation: cell manufacturing. This process, dominated by Asian giants like CATL and LG Energy Solution, is a marvel of precision that consumes electricity on an industrial scale.
The largest energy sinks are electrode drying and cell formation. Coating anode and cathode slurries onto metal foils requires massive, heated dryers. The formation step, where cells are first charged to stabilize their chemistry, can take days in climate-controlled chambers. This phase alone can account for 25-40% of the total energy consumed in manufacturing.
Here, location is destiny. The carbon content of the local electrical grid dictates the manufacturing emissions. A battery cell produced in Sichuan, China, using hydropower, may have a footprint of 60 kg CO2 per kWh. The same cell made in Poland, reliant on coal, could exceed 150 kg CO2 per kWh. For a 75 kWh pack, this variance of 4.5 to 11 tons of CO2 is monumental—it is the difference between the EV having a modest or a massive upfront debt.
The Trilemma of Battery Chemistry#
Battery development is a constant exercise in triage, balancing energy density, cost, longevity, safety, and environmental impact. Each choice reshuffles the ledger.
The industry’s shift from NMC 111 to NMC 811 (higher nickel, lower cobalt) was driven by energy density and cost reduction. The environmental trade-off is severe: nickel’s refining is carbon-intensive, and high-nickel cathodes can be less stable, potentially requiring more complex (and resource-heavy) thermal management systems.
The rise of Lithium Iron Phosphate (LFP) batteries represents a different calculus. LFP uses no nickel or cobalt, sidestepping their ethical and carbon pitfalls. It is also cheaper and more stable. The trade-off is lower volumetric energy density, meaning a heavier, bulkier pack for the same range. This can increase a vehicle’s operational energy use, displacing the emissions reduction from manufacturing to the in-use phase. It is a classic accounting trade-off: improve one column of the ledger at the potential expense of another.
The Amortization Schedule of Clean Miles#
The upfront carbon debt is not an argument against electrification; it is the essential down payment. The critical question is the carbon payback period: how many miles must be driven before the EV’s operational advantage clears the initial debt?
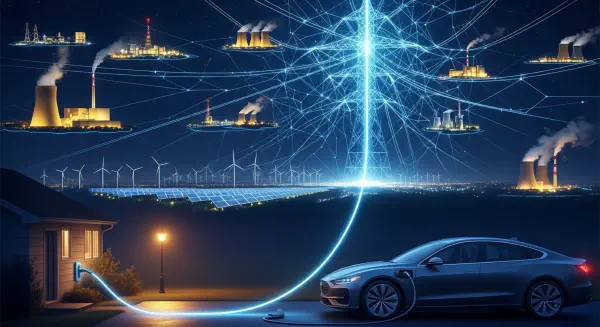
This period is highly variable. A 2023 study by the International Council on Clean Transportation modeled a typical EV in Europe. With a battery made using the EU’s average grid mix, the payback period versus a gasoline car was about 21,000 miles. With a battery manufactured in China using a coal-heavy grid, the period extended to nearly 50,000 miles. In a grid with a high share of renewables (e.g., Norway), the payback could occur in under 15,000 miles.
This variability reveals the flaw in treating the EV as a monolithic green good. Its environmental value is not stamped at the factory; it is a function of two dynamic systems: the industrial energy used to build its battery and the electrical energy used to power it. A coal-powered supply chain and a coal-powered grid create a vehicle of marginal benefit. A renewable-powered supply chain and grid create a transformative one.
Therefore, the true imperative of the EV transition is not merely to build more cars, but to green the factories that build them and the grids that charge them. The battery’s buried carbon is the clearest possible signal that sustainability cannot be achieved by changing the product alone. We must change the process. The ledger demands it.