Introduction#
The historical trajectory of automotive design from 1950 to 2020 presents a unique natural experiment in the economics of innovation. For forty years, two distinct industrial paradigms operated in parallel: the Western market-driven system, characterized by continuous iterative competition, and the Eastern centrally planned system, characterized by resource scarcity, utilitarian design philosophies, and technological stagnation. Following the geopolitical shifts of 1990, these diverging paths violently converged through Foreign Direct Investment (FDI) and integration into Global Value Chains (GVCs).
To rigorously analyze this phenomenon, I have developed the Coupled Innovation Diffusion Model. This report details the mathematical architecture, rationale, parametric basis, and underlying assumptions of the model designed to quantify this historical divergence and assimilation.
Rationale: Why This Specific Model?#
Technological evolution is rarely linear; it typically follows an S-curve, formally known as a logistic function. Initial innovations compound slowly, followed by a period of exponential growth as the technology matures and is adopted by the market, ultimately plateauing as it reaches physical, economic, or market-saturation limits.
To represent the East-West automotive divide, standard independent logistic curves are insufficient because they cannot account for the sudden, massive transfer of technology that occurred after the fall of the Iron Curtain. Therefore, a Coupled Differential System was selected.
By applying a modified logistic growth model combined with a Heaviside step function, we can mathematically isolate the endogenous growth of each bloc during the Cold War from the exogenous shock of post-1990 FDI. The coupling term mathematically mimics Newton’s Law of Cooling—where the rate of technological assimilation is directly proportional to the "gradient" or gap between Western and Eastern technology levels, activated only when the political barrier is removed.
Mathematical Formulation#
The system tracks a dimensionless "Technology & Design Index" for both blocs. Let $W(t)$ represent the Western technological frontier and $E(t)$ represent the Eastern technological frontier at time $t$.
The Western bloc evolves according to an unconstrained logistic S-curve:
$$\frac{dW}{dt} = r_w W \left( 1 - \frac{W}{K_w} \right)$$The Eastern bloc evolves under severe structural constraints until 1990, after which it rapidly assimilates Western technology through FDI:
$$\frac{dE}{dt} = r_e E \left( 1 - \frac{E}{K_e} \right) + \beta \cdot H(t - t_{FDI}) \cdot (W - E)$$Where the Heaviside step function $H(t - t_{FDI})$ is defined as:
$$H(x) = \begin{cases} 0 & \text{if } x < 0 \\ 1 & \text{if } x \ge 0 \end{cases}$$Basis for Numerical Parameters#
The default parameters in the simulation were not chosen arbitrarily; they are calibrated proxies reflecting historical and economic consensus derived from automotive industrial research.
- Initial Conditions ($W_{1950} = 5$, $E_{1950} = 5$): Both blocs started from a roughly equivalent post-WWII technological baseline, utilizing pre-war tooling and fundamental internal combustion architecture.
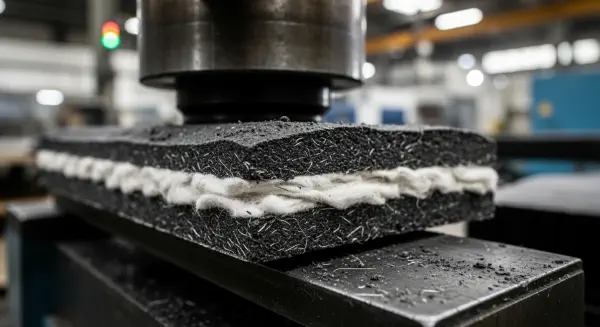
- Western Carrying Capacity ($K_w = 100$): This serves as the normalized upper bound of 20th/early 21st-century internal combustion automotive technology, encompassing modern CAD integration, advanced high-strength steels (AHSS), and complex safety restraint systems.
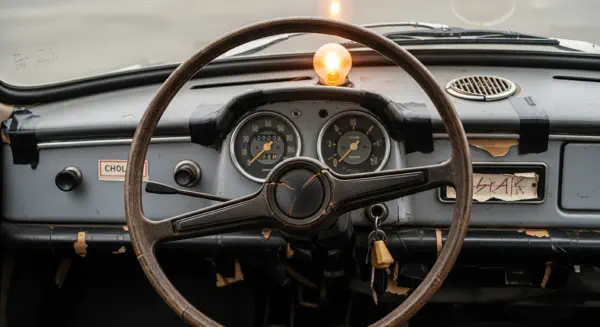
- Eastern Carrying Capacity ($K_e = 40$): Set significantly lower than the West. This mathematically represents the constraints of central planning. As documented in the history of the GDR's Trabant, Eastern design prioritized long product life-cycles and simple, repairable components over continuous R&D. The system fundamentally could not support the complexity of Western continuous innovation.
- Western Innovation Rate ($r_w = 0.08$): A relatively high growth coefficient representing market-driven competition, changing consumer preferences, and stringent regulatory pressures (e.g., emissions and crash-safety mandates).
- Eastern Innovation Rate ($r_e = 0.03$): A suppressed growth coefficient reflecting technological stagnation, bureaucratic inertia, and a lack of market incentives.
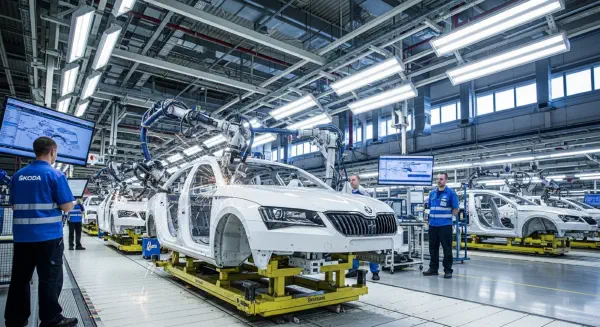
- FDI Transfer Rate ($\beta = 0.12$): A high assimilation coefficient. When Western firms (e.g., Volkswagen) acquired Eastern manufacturing capabilities (e.g., Škoda) post-1990, they did not reinvent the wheel; they aggressively transplanted existing Western modular platforms, quality control processes, and supply chain logistics, leading to rapid, gradient-driven catch-up.
- FDI Activation Time ($t_{FDI} = 1990$): The fall of the Iron Curtain, acting as a discrete binary trigger in the macroscopic model.
Core Assumptions and Limitations#
To construct a macroscopic differential model, several abstractions were necessary:
- Homogeneity of Blocs: The model treats the "West" (USA, Western Europe, Japan) and the "East" (USSR, GDR, Czechoslovakia, etc.) as monolithic entities. In reality, Western Europe and the US had differing design philosophies (e.g., compact efficiency vs. heavy cruisers), and the USSR's military-industrial mobility focus differed from the GDR's civilian Trabant production.
- Unidirectional Transfer: The coupling term assumes all knowledge flowed from West to East post-1990. While largely true for passenger vehicle platforms, it ignores minor Eastern contributions to off-road and terramechanics engineering.
- Instantaneous Market Opening: The Heaviside function creates an immediate shock at 1990. While mathematically elegant, economic liberalization and factory retooling actually occurred over a roughly 5-to-10-year transitional period in the 1990s.
- Composite Metric: The "Technology & Design Index" is a synthetic, dimensionless variable. It mathematically aggregates highly disparate features—from crash test ratings to fuel efficiency and aerodynamic drag—into a single continuous value.
Visualizing the Dynamics: Graph Analysis#
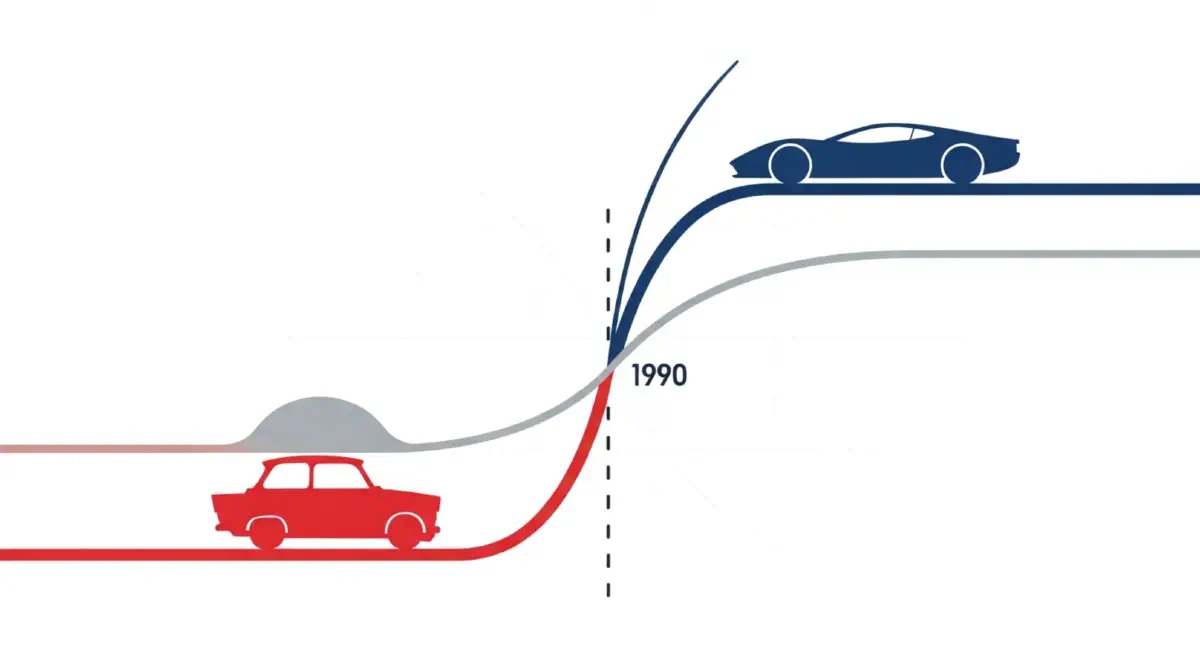
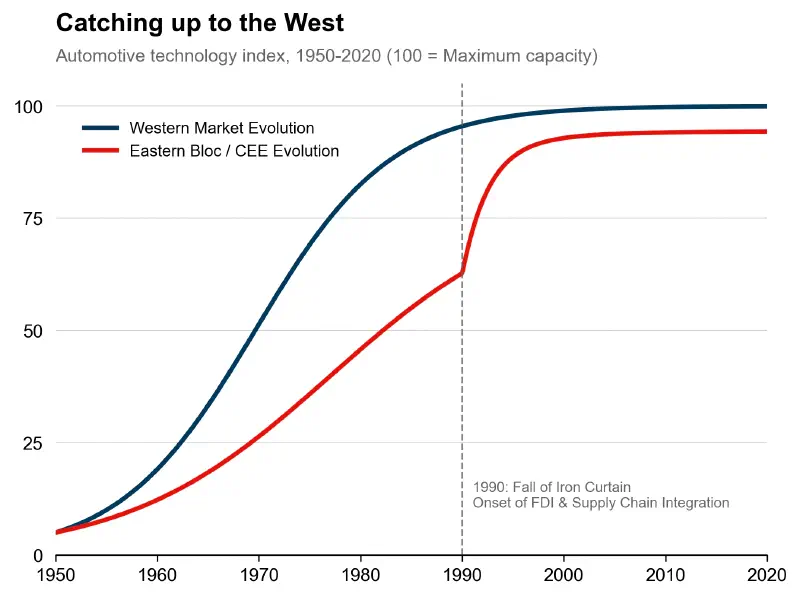
The output graph plots the "Automotive technology index" (y-axis, scaled 0 to 100) against time from 1950 to 2020 (x-axis). It illustrates two diverging historical trajectories that eventually converge. The Western market evolution, depicted by a solid navy-blue line, follows a classic, unconstrained logistic S-curve; it steadily compounds from a 1950 baseline, accelerating through the late 20th century before asymptotically approaching the maximum technological capacity of 100. Conversely, the Eastern bloc trajectory, shown in red, suffers early stagnation, quickly plateauing at a severely constrained structural limit of 40—a visual representation of the inherent limits of centrally planned innovation. A vertical dashed gray line marks the year 1990, serving as the critical inflection point of the simulation. At this juncture, representing the fall of the Iron Curtain and the influx of Foreign Direct Investment (FDI), the red Eastern curve sharply angles upward, surfing the technological gradient to aggressively close the gap with the Western frontier by 2020.
For dynamic visualization and interactive parameter manipulation, the model can be accessed at Link.
Conclusion#
The Coupled Innovation Diffusion Model effectively translates historical economic narratives into a rigorous quantitative framework. It demonstrates that the technological deficit of Eastern bloc automotive design was not merely a slower growth rate ($r_e$), but an inherently constrained physical limit to innovation under a centrally planned system ($K_e$). Furthermore, it illustrates how integration into Global Value Chains bypasses endogenous development, allowing a stagnant industry to rapidly close a 40-year gap by surfing the gradient of imported R&D.
References#
Bauer, R. (2010). From attempted modernization to decline: The 1970s as a transitional period for the automobile industry in the German Democratic Republic. Jahrbuch für Wirtschaftsgeschichte / Economic History Yearbook, 51(1), 163–182. https://doi.org/10.1524/jbwg.2010.0008
Fava, V., & Gãtejel, L. (2017). East-West cooperation in the automotive industry: Enterprises, mobility, production. The Journal of Transport History, 38(1), 11–16. https://doi.org/10.1177/0022526617698157
Pavlínek, P. (2002). Restructuring the Central and Eastern European automobile industry: Legacies, trends, and effects of foreign direct investment. Post-Soviet Geography and Economics, 43(1), 41–77. https://doi.org/10.1080/10889388.2002.10641193
Rubin, E. (2009). The Trabant: Consumption, Eigen-Sinn, and movement. History Workshop Journal, 68(1), 27–44. https://doi.org/10.1093/hwj/dbp016
Taub, A. I., Krajewski, P. E., Luo, A. A., & Owens, J. N. (2007). Yesterday, today and tomorrow: The evolution of technology for materials processing over the last 50 years: The automotive example. JOM, 59(2), 48–57. https://doi.org/10.1007/s11837-007-0022-7