From Sketch to Street: The True Cost of Building a Car
automotive development, car manufacturing, vehicle production timeline, automotive R&D costs, digital factories, development cycles
The Race Against Time
Ever wondered why that sleek new car model took so long to hit the showroom floor? The answer involves billions of dollars, thousands of engineers, and a development process that’s evolved dramatically over the past four decades.
The automotive industry has undergone a remarkable transformation in how quickly it can bring new vehicles to market. In the pre-1980s era, when designers worked with clay models and chalk drawings, developing a new car took a grueling 60 months—five full years of intensive work before the first vehicle rolled off the production line.
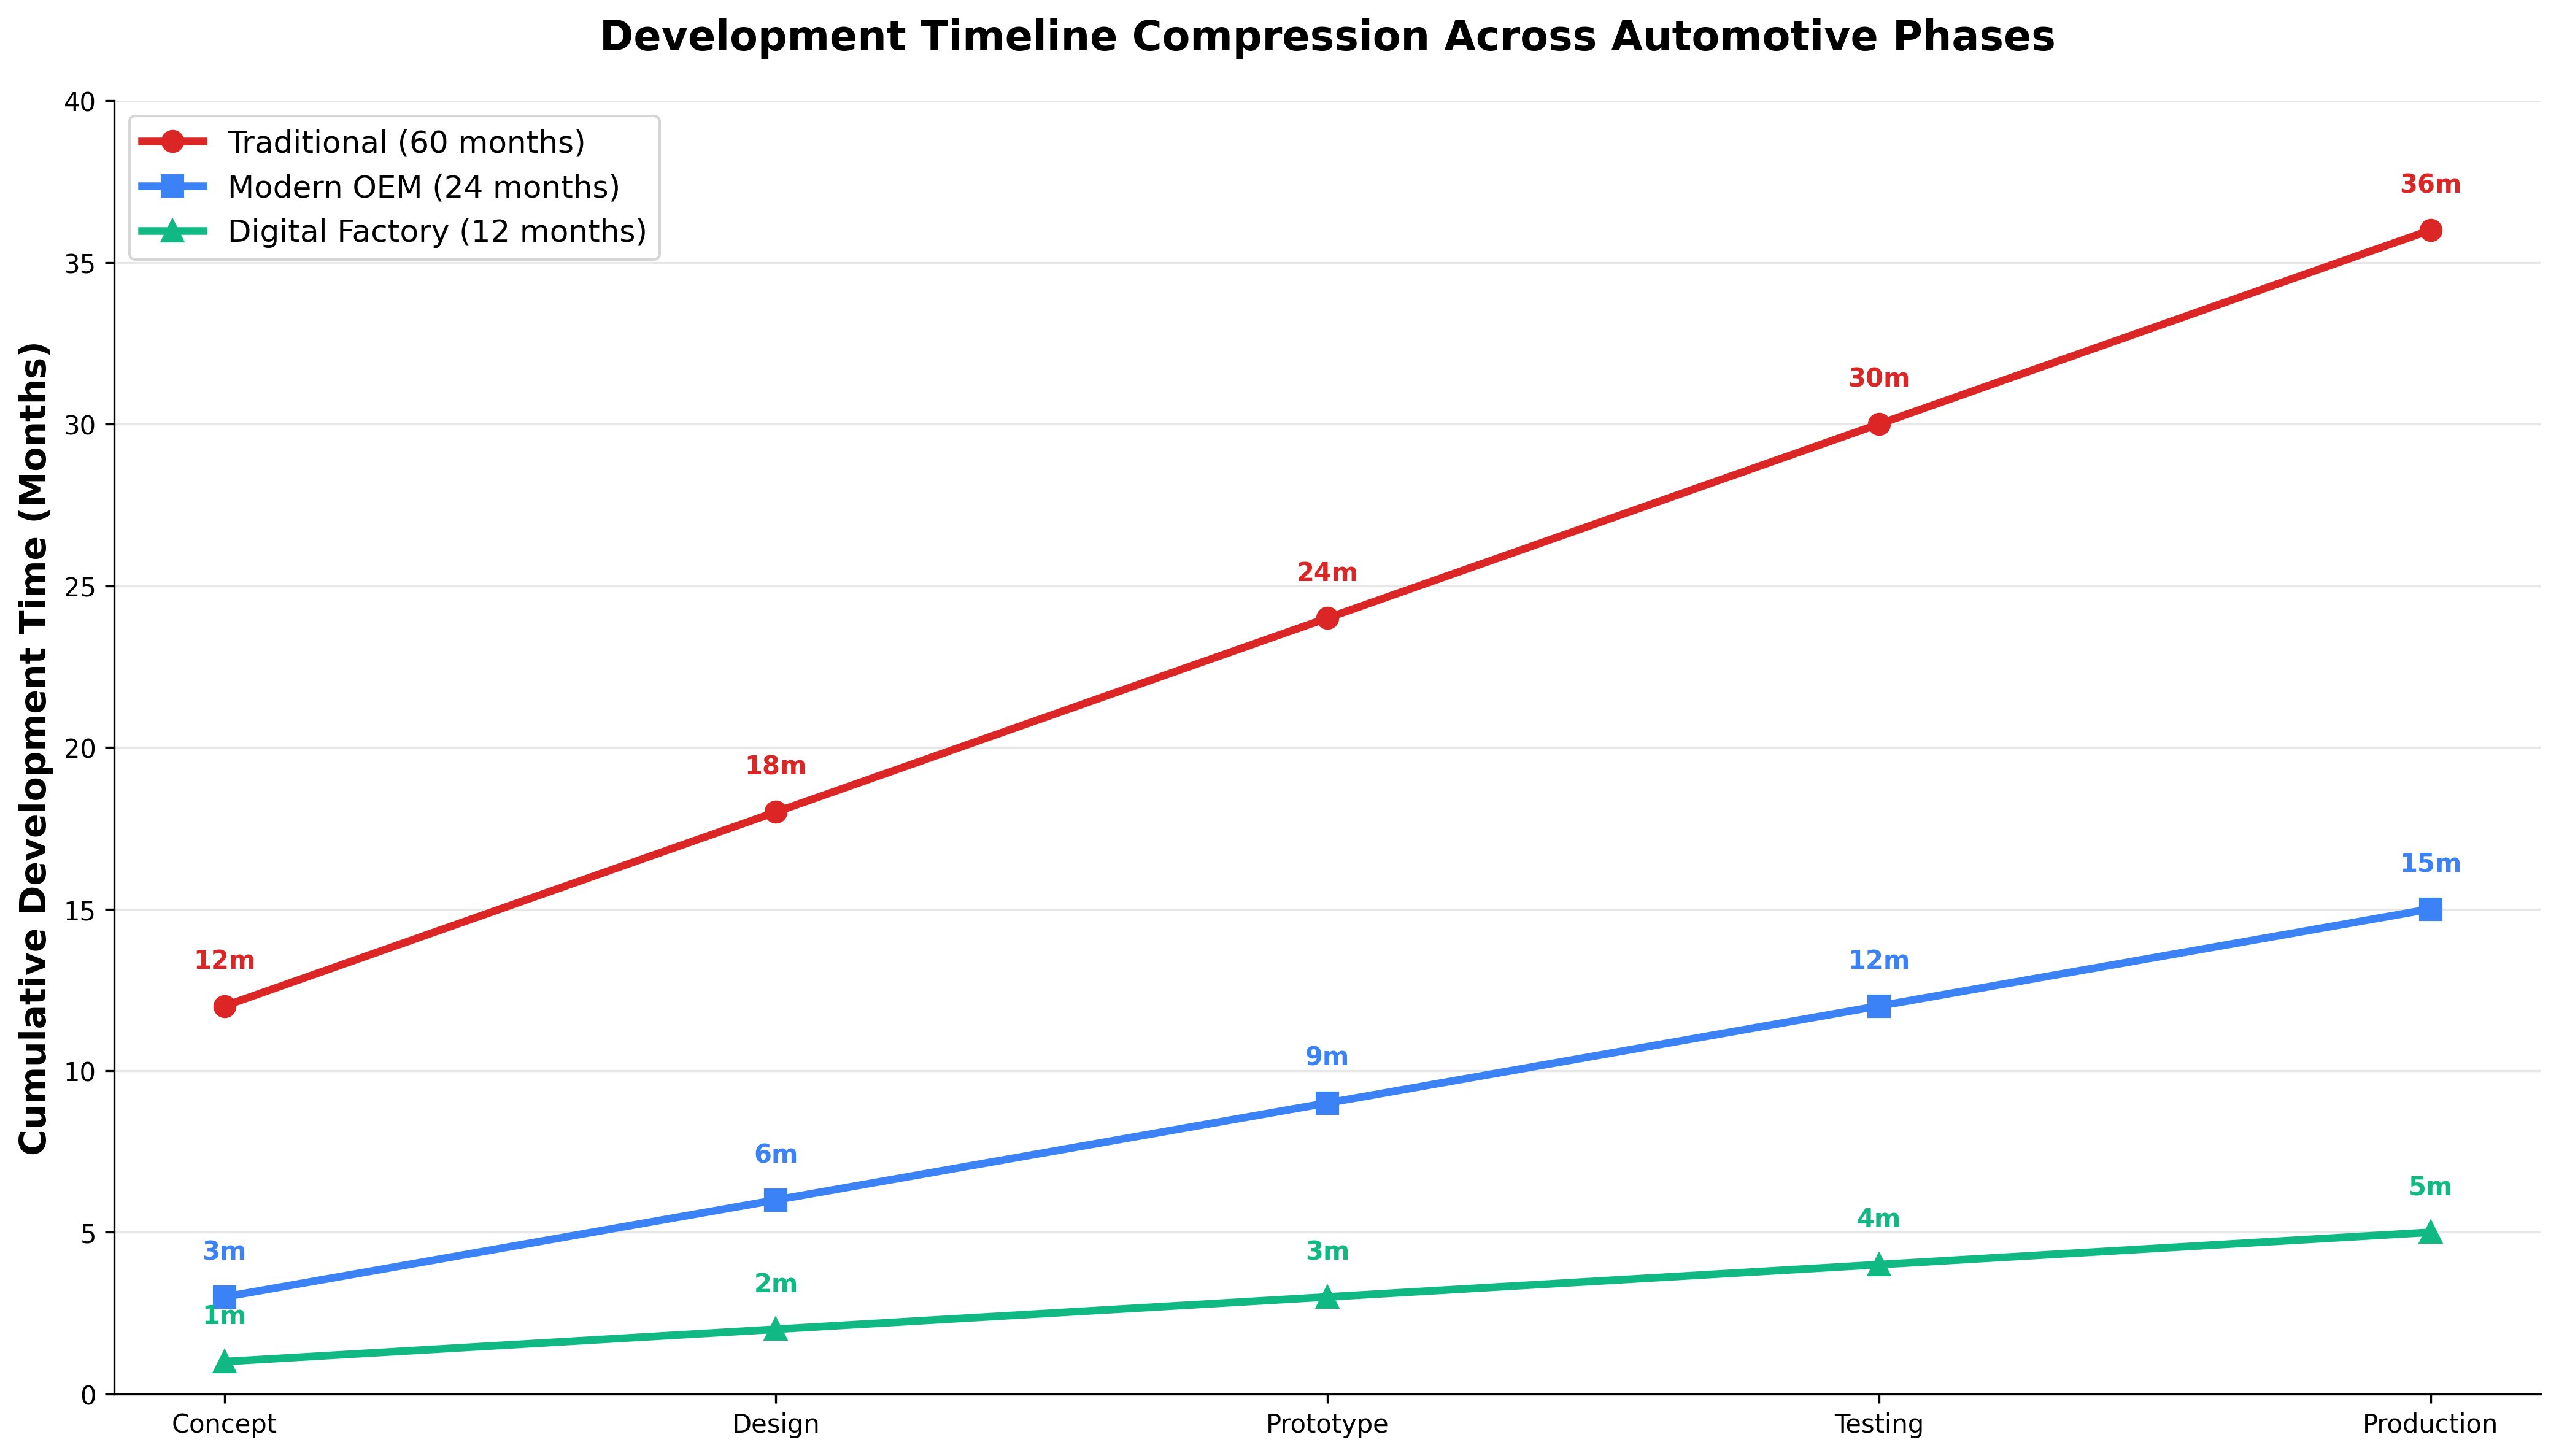
Today’s landscape is far more diverse:
- Digital Factories: 12 months (cutting-edge companies)
- Modern OEMs: 48 months (mainstream manufacturers)
- Pre-1980s Era: 60 months (traditional process)
Some innovative companies like Renault are targeting an ambitious two-year development cycle for their electric vehicles, leveraging advanced IT systems and platform sharing to accelerate time-to-market.
The Billion-Dollar Question
The financial stakes in automotive development are staggering. Research and development costs can reach up to $6 billion for a new vehicle platform, with typical projects costing around $1.5 billion. But here’s the crucial insight: between 70% and 90% of total project costs are locked in during the R&D and design phases.
Where the Money Goes
The rise of electronics has fundamentally changed the cost structure. In 1989, electronic equipment represented just 16% of a car’s total cost. By 2010, this had jumped to 23%, and estimates suggested it could reach 40% by 2015. In luxury vehicles, electronics now account for more than half the total cost—a dramatic shift from the mechanical-dominated era.
Perhaps most sobering is the cost of getting things wrong. Poor quality accounts for 20% to 40% of the annual cost of manufactured parts. Design flaws discovered after launch can cost hundreds of millions to rectify—one manufacturer spent $250 million fixing post-launch issues.
Even more dramatic: one OEM estimated that being three months late on a major launch resulted in losing 60% of the lifecycle profit.
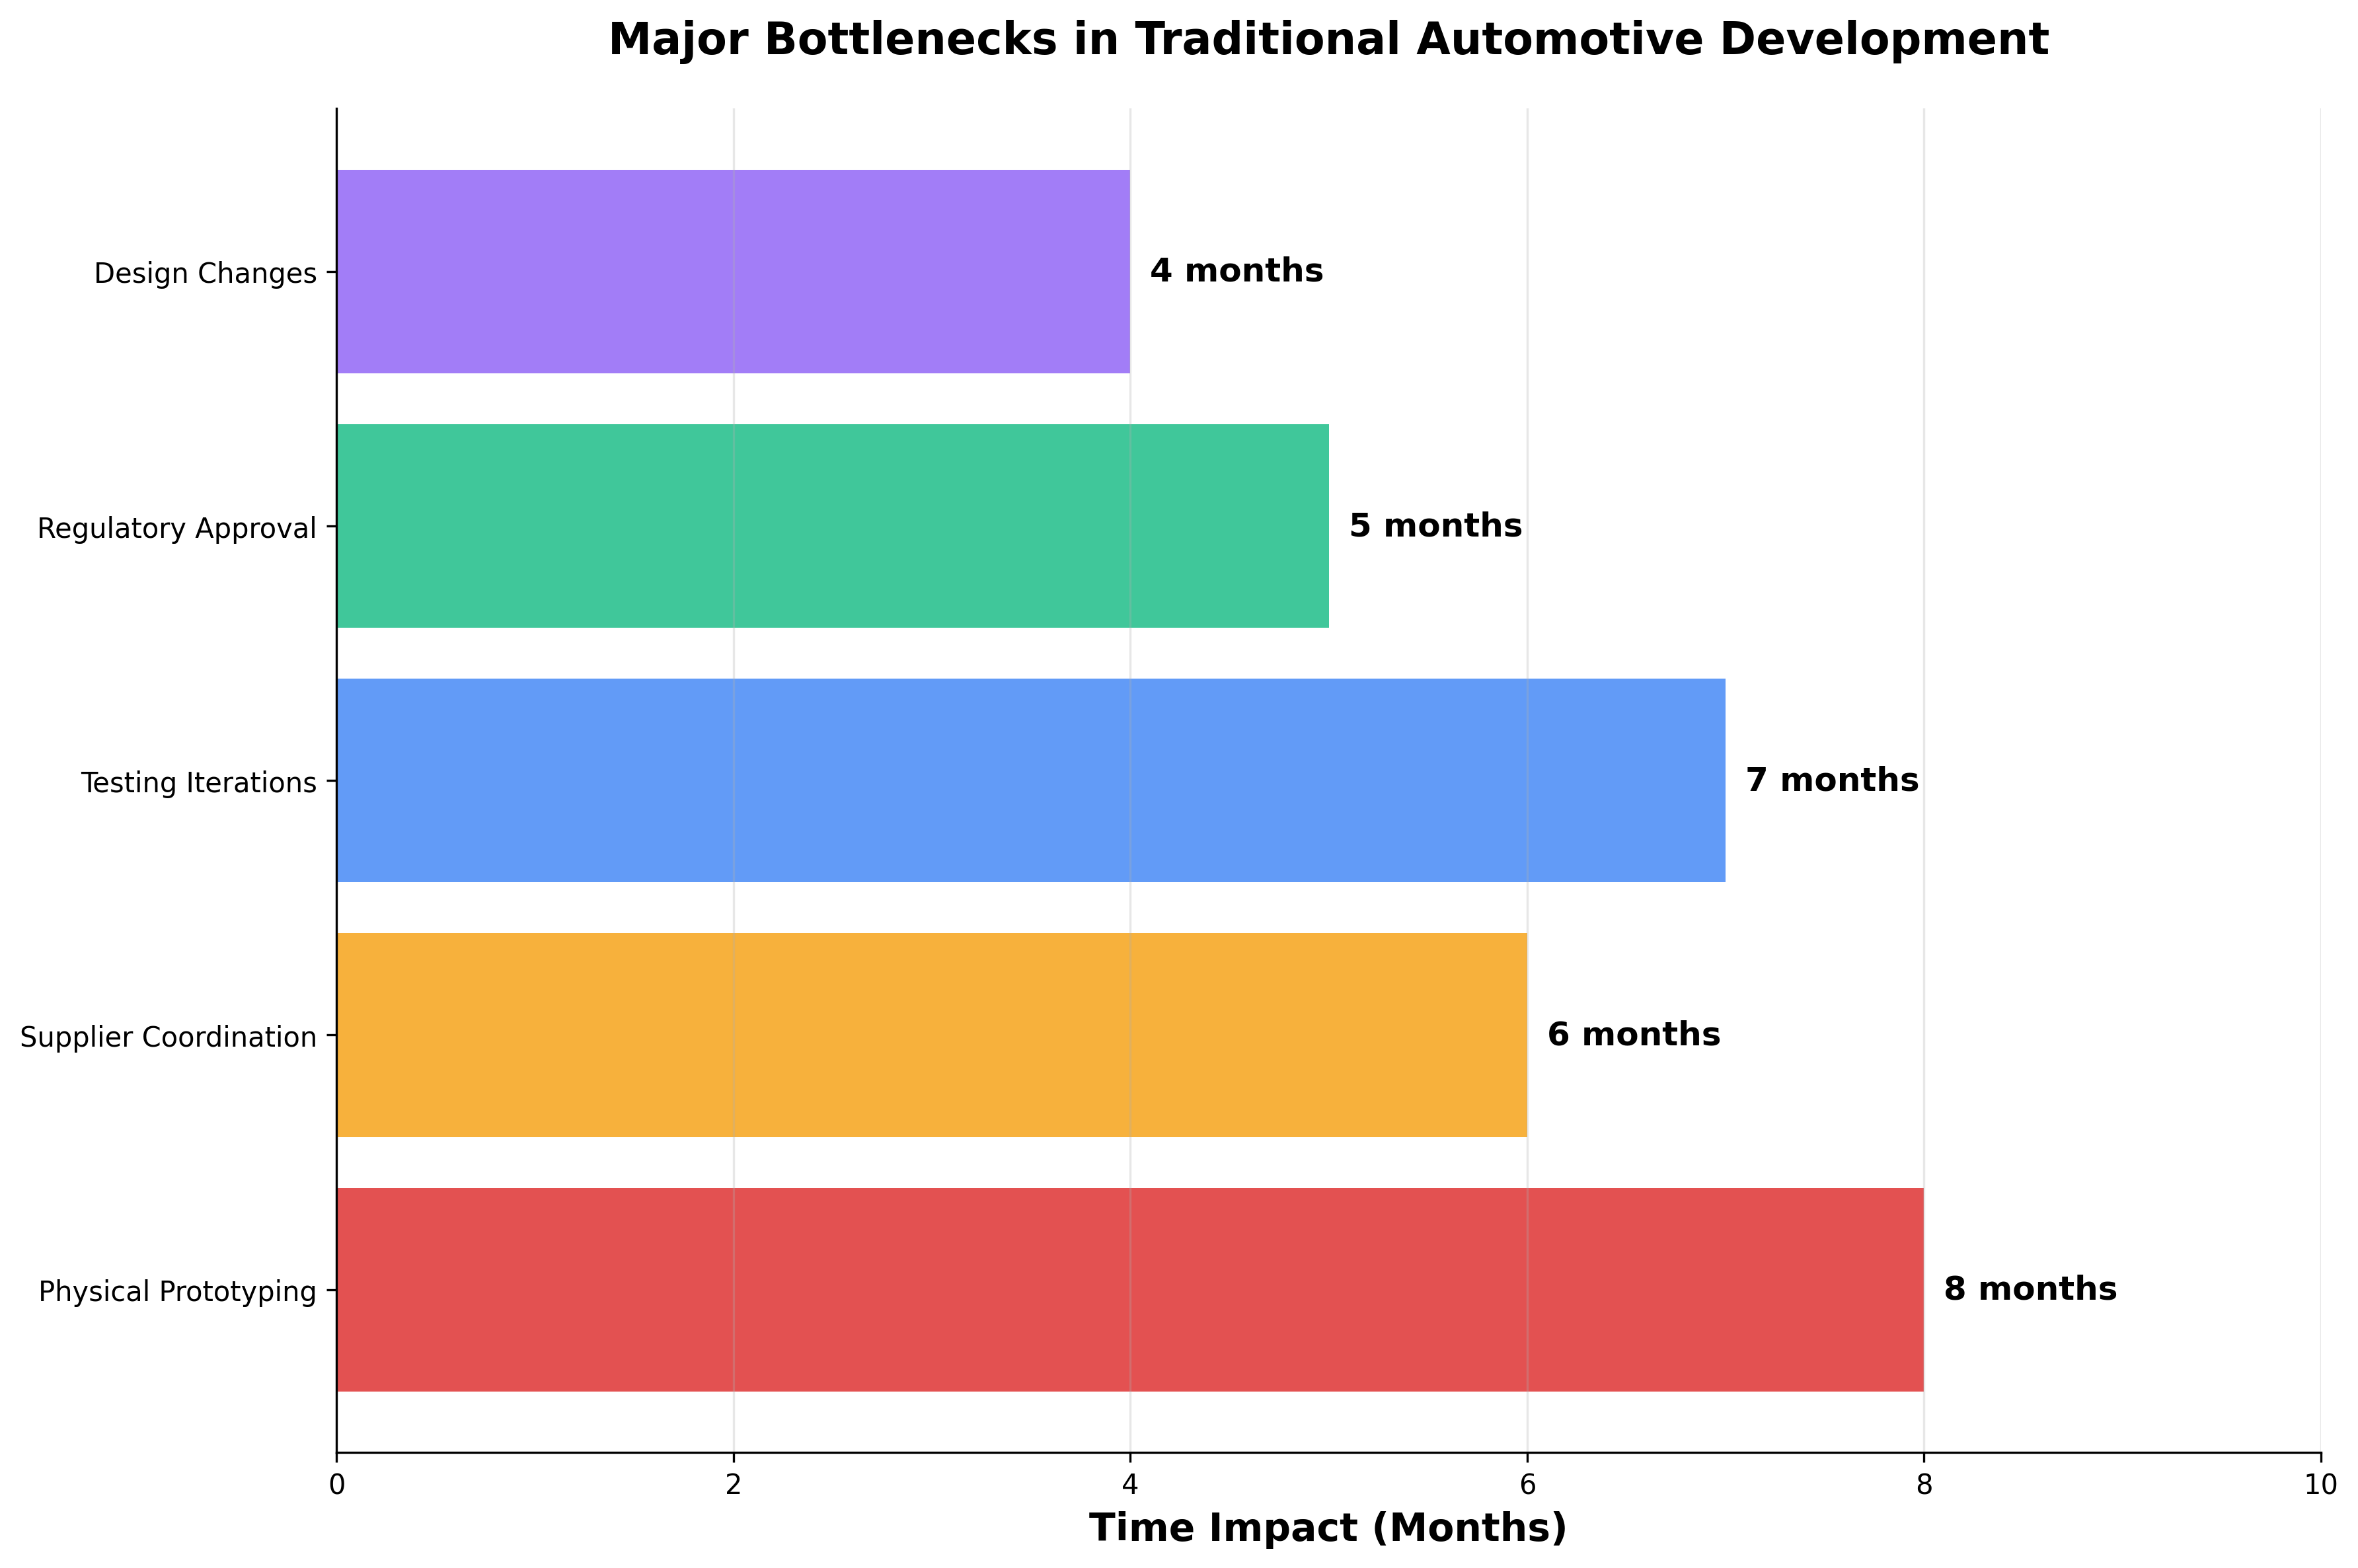
The Development Timeline Breakdown
The journey from concept to production involves six critical stages:
1. Concept Development
Market research, customer needs analysis, and initial feasibility studies define the vehicle’s requirements and specifications.
2. Design & Engineering
Detailed design work including CAD modeling, systems engineering, and component specification. Modern processes leverage digital twins and AI-assisted design tools.
3. Prototyping
Physical and digital prototype creation for testing and validation. 3D printing and virtual reality simulations accelerate this phase significantly.
4. Validation & Testing
Comprehensive testing including crash tests, durability trials, regulatory compliance, and performance validation across multiple conditions.
4. Validation & Testing
Comprehensive testing including crash tests, durability trials, regulatory compliance, and performance validation across multiple conditions.
5. Tooling & Manufacturing Setup
Production line setup, tooling fabrication, and supplier qualification. Digital manufacturing and modular platforms reduce setup time.
6. Production Launch
Final production ramp-up, quality assurance, and market introduction. Modern processes enable faster scaling and iteration.
The Digital Revolution
The transformation from clay models to digital twins has been nothing short of revolutionary. European development times dropped from 40 months in the mid-1990s to just 25 months by 2005, driven by process improvements and computer simulations that replaced expensive physical prototypes.
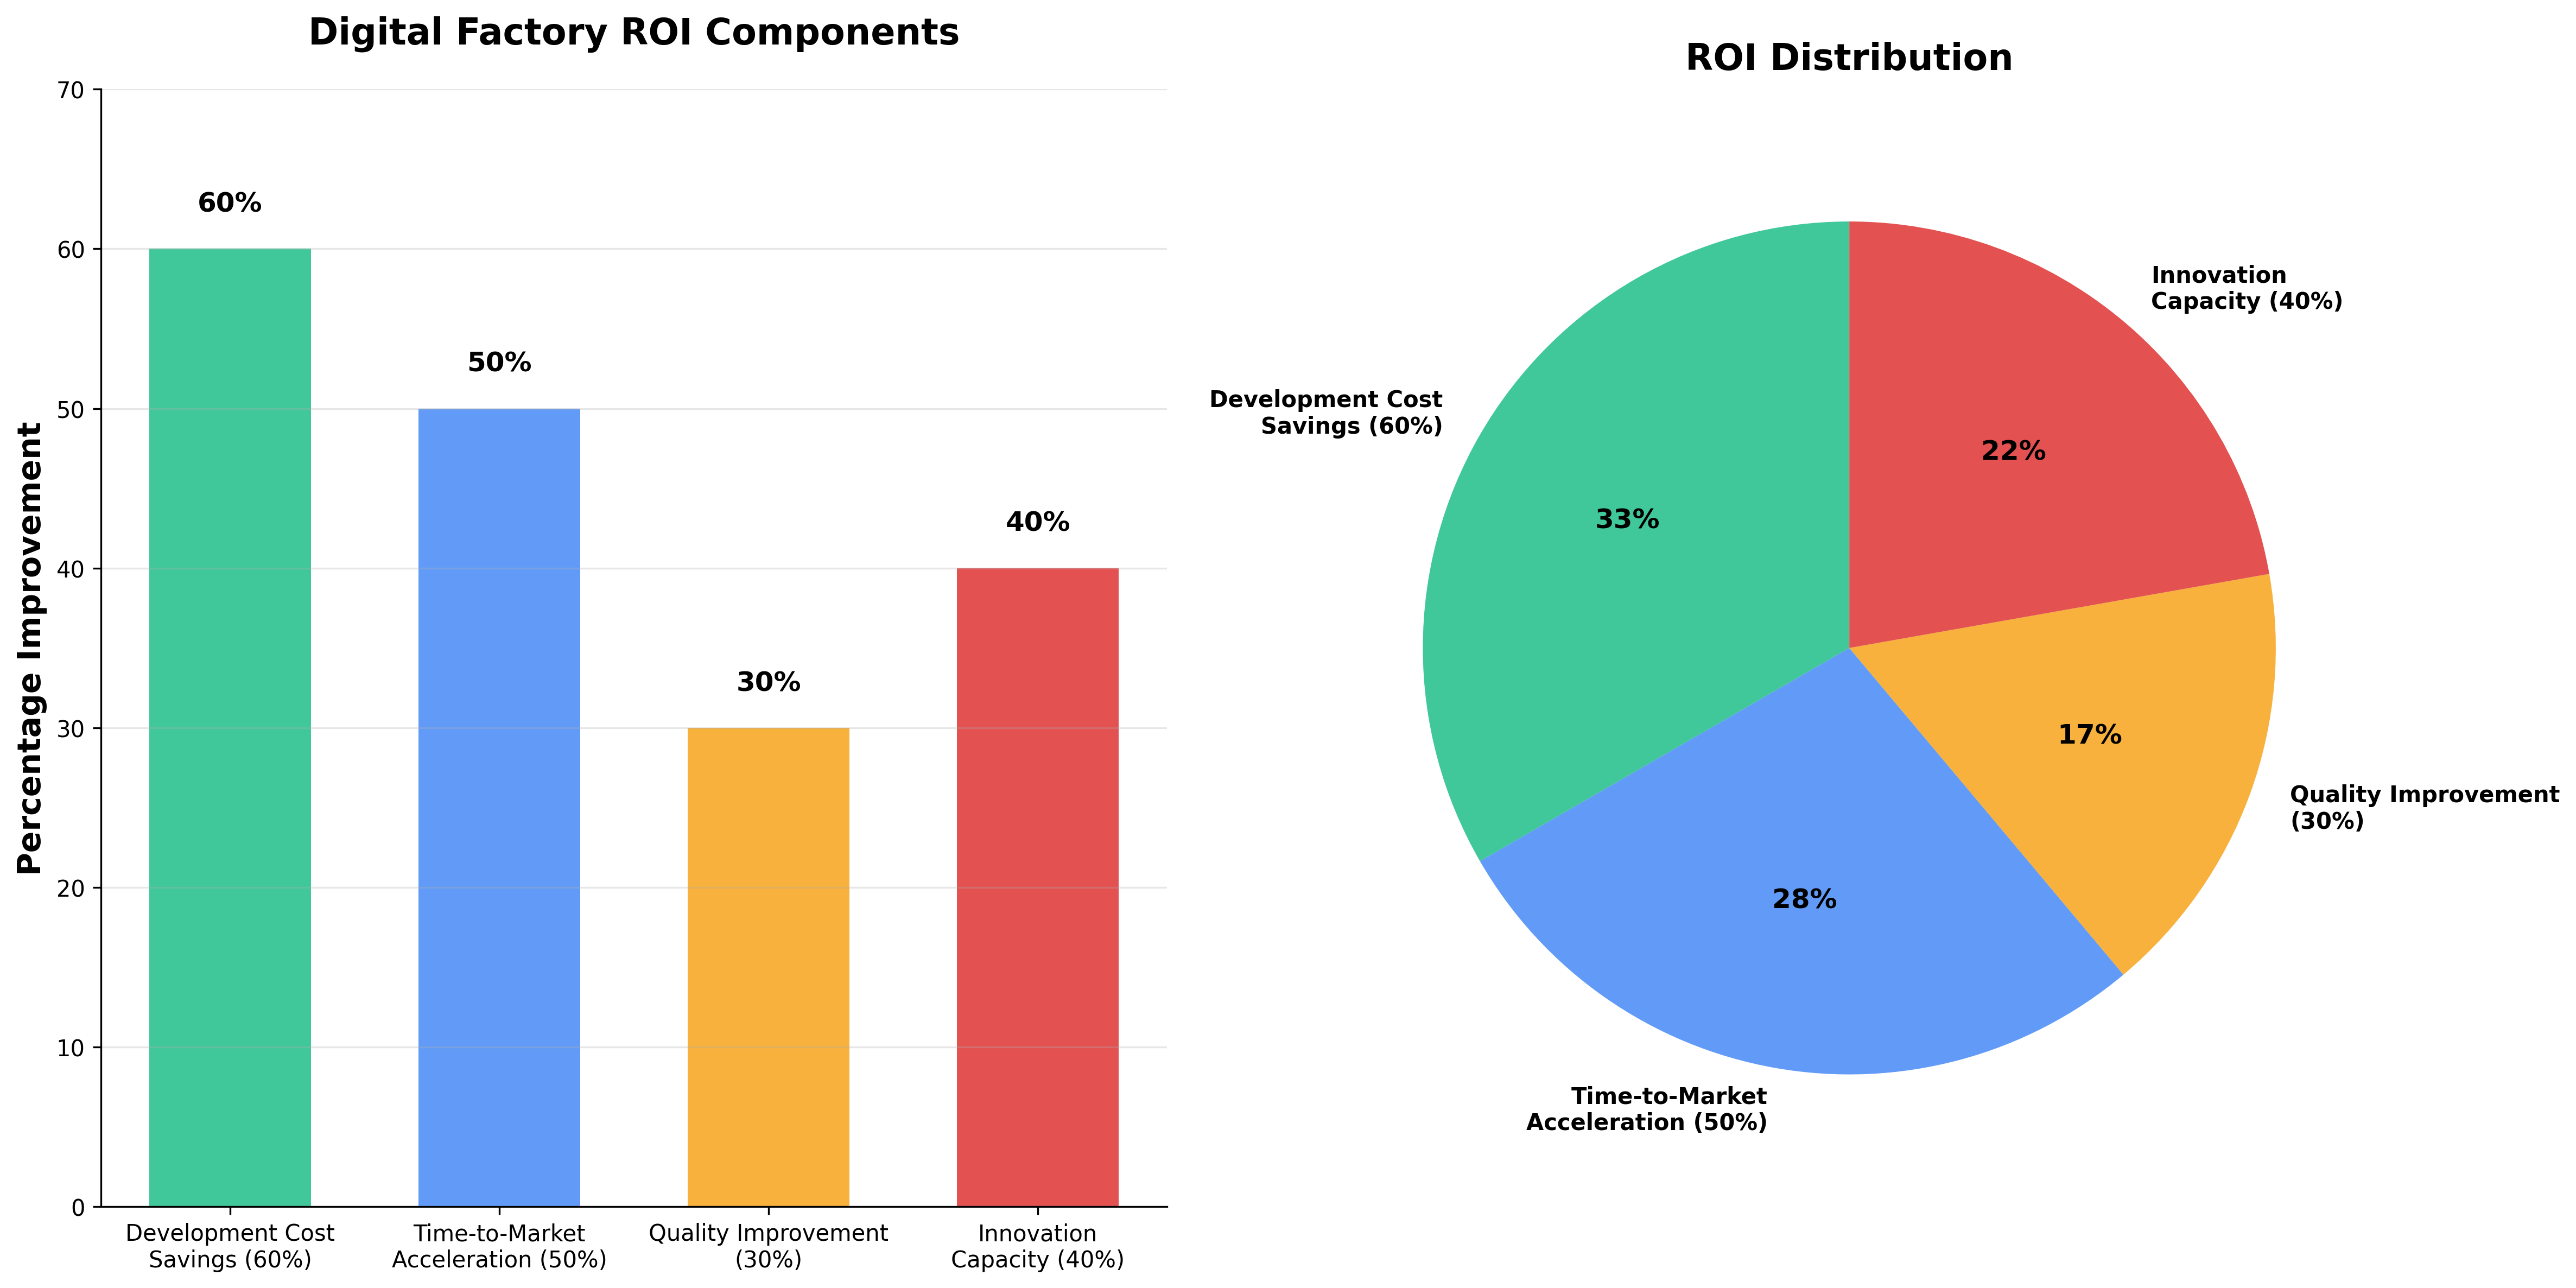
Virtual testing and digital tools have become essential for achieving shorter development cycles. Using standardized code bases and virtual commissioning can lead to 20% to 40% faster design time and significant manpower cost savings.
These technologies don’t just speed up development—they fundamentally change it, allowing engineers to test thousands of scenarios that would be impossible or prohibitively expensive in the physical world.
The High Stakes of Delay
The stakes have never been higher. With every day of delay costing approximately $1 million in lost sales, and with development costs heavily weighted toward payroll, the race to compress development timelines isn’t just about being first to market—it’s about fundamental economic survival in an increasingly competitive global industry.
Why Speed Matters
- Competitive Advantage: Companies that master accelerated development can bring innovations to market faster
- Cost Reduction: Shorter cycles reduce development costs and enable more frequent product refreshes
- Risk Management: Faster iteration allows quicker response to market changes and regulatory requirements
- Profit Protection: Being three months late can cost 60% of lifecycle profits
Looking Ahead
As the automotive industry continues its shift toward electric and autonomous vehicles, these development timelines and costs will likely continue to evolve, with digital-native manufacturers setting new benchmarks that traditional OEMs must race to match.
The transformation from 60-month development cycles to potentially sub-year timelines represents one of the most significant shifts in automotive industry history, enabling faster innovation and more responsive product development.
Data and Methodology
Data sources: Academic studies and industry reports spanning 2008-2023, including peer-reviewed journals and OEM case studies
Analysis approach: Comparative analysis of traditional vs. modern digital development processes across multiple automakers
Cost estimates: Based on industry averages; actual costs vary significantly by manufacturer, platform, and vehicle segment
Timeline data: Represents typical industry practices; luxury and specialty vehicles may require longer development cycles
Sources
- Ginsberg M. (2008). Bibliographic Snapshots of High-Performance/High-Productivity Computing. Advances in Computers, Vol. 72.
- Johnson A. (2014). Sustainability and Its Application Within Engineering Design. Sustainability in Engineering Design.
- Greene J. (2021). Design Aspects in Automotive Plastics and Composites. Automotive Plastics and Composites.
- Samuel P., et al. (2023). Artificial intelligence–driven digital twins in Industry 4.0. Digital Twin for Smart Manufacturing.
- Alcázar-García D., Romeral Martínez J. (2022). Model-based design validation and optimization of drive systems. Energy, Vol. 254.
- Hertenstein P., Williamson P. (2018). The role of suppliers in enabling differing innovation strategies. Technovation, Vol. 70.
- Warner J. (2015). Introduction. The Handbook of Lithium-Ion Battery Pack Design.
- Hofmann R. (2015). Visionary competence for long-term development of brands. Technological Forecasting and Social Change, Vol. 101.
Want to see specific data analyzed? Contact us with your research questions.